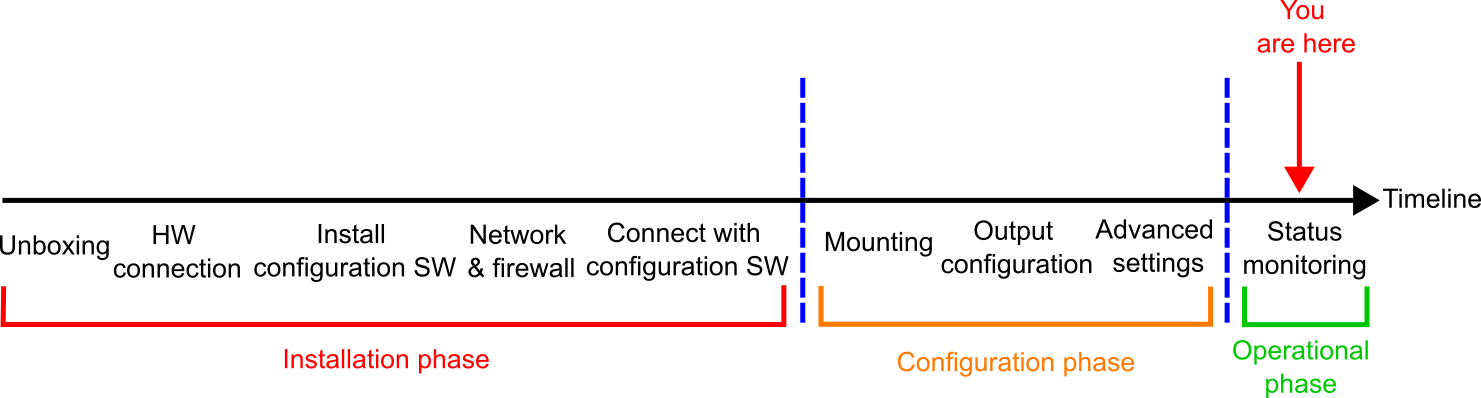
Status monitoring
This guide provides step-by-step instructions for accessing detailed health status information for your MRU.
To view the MRU’s health status in detail, do the following:
Open the MRU configurator and connect to your MRU
Click “Settings“->”Input & Output” in the left bar
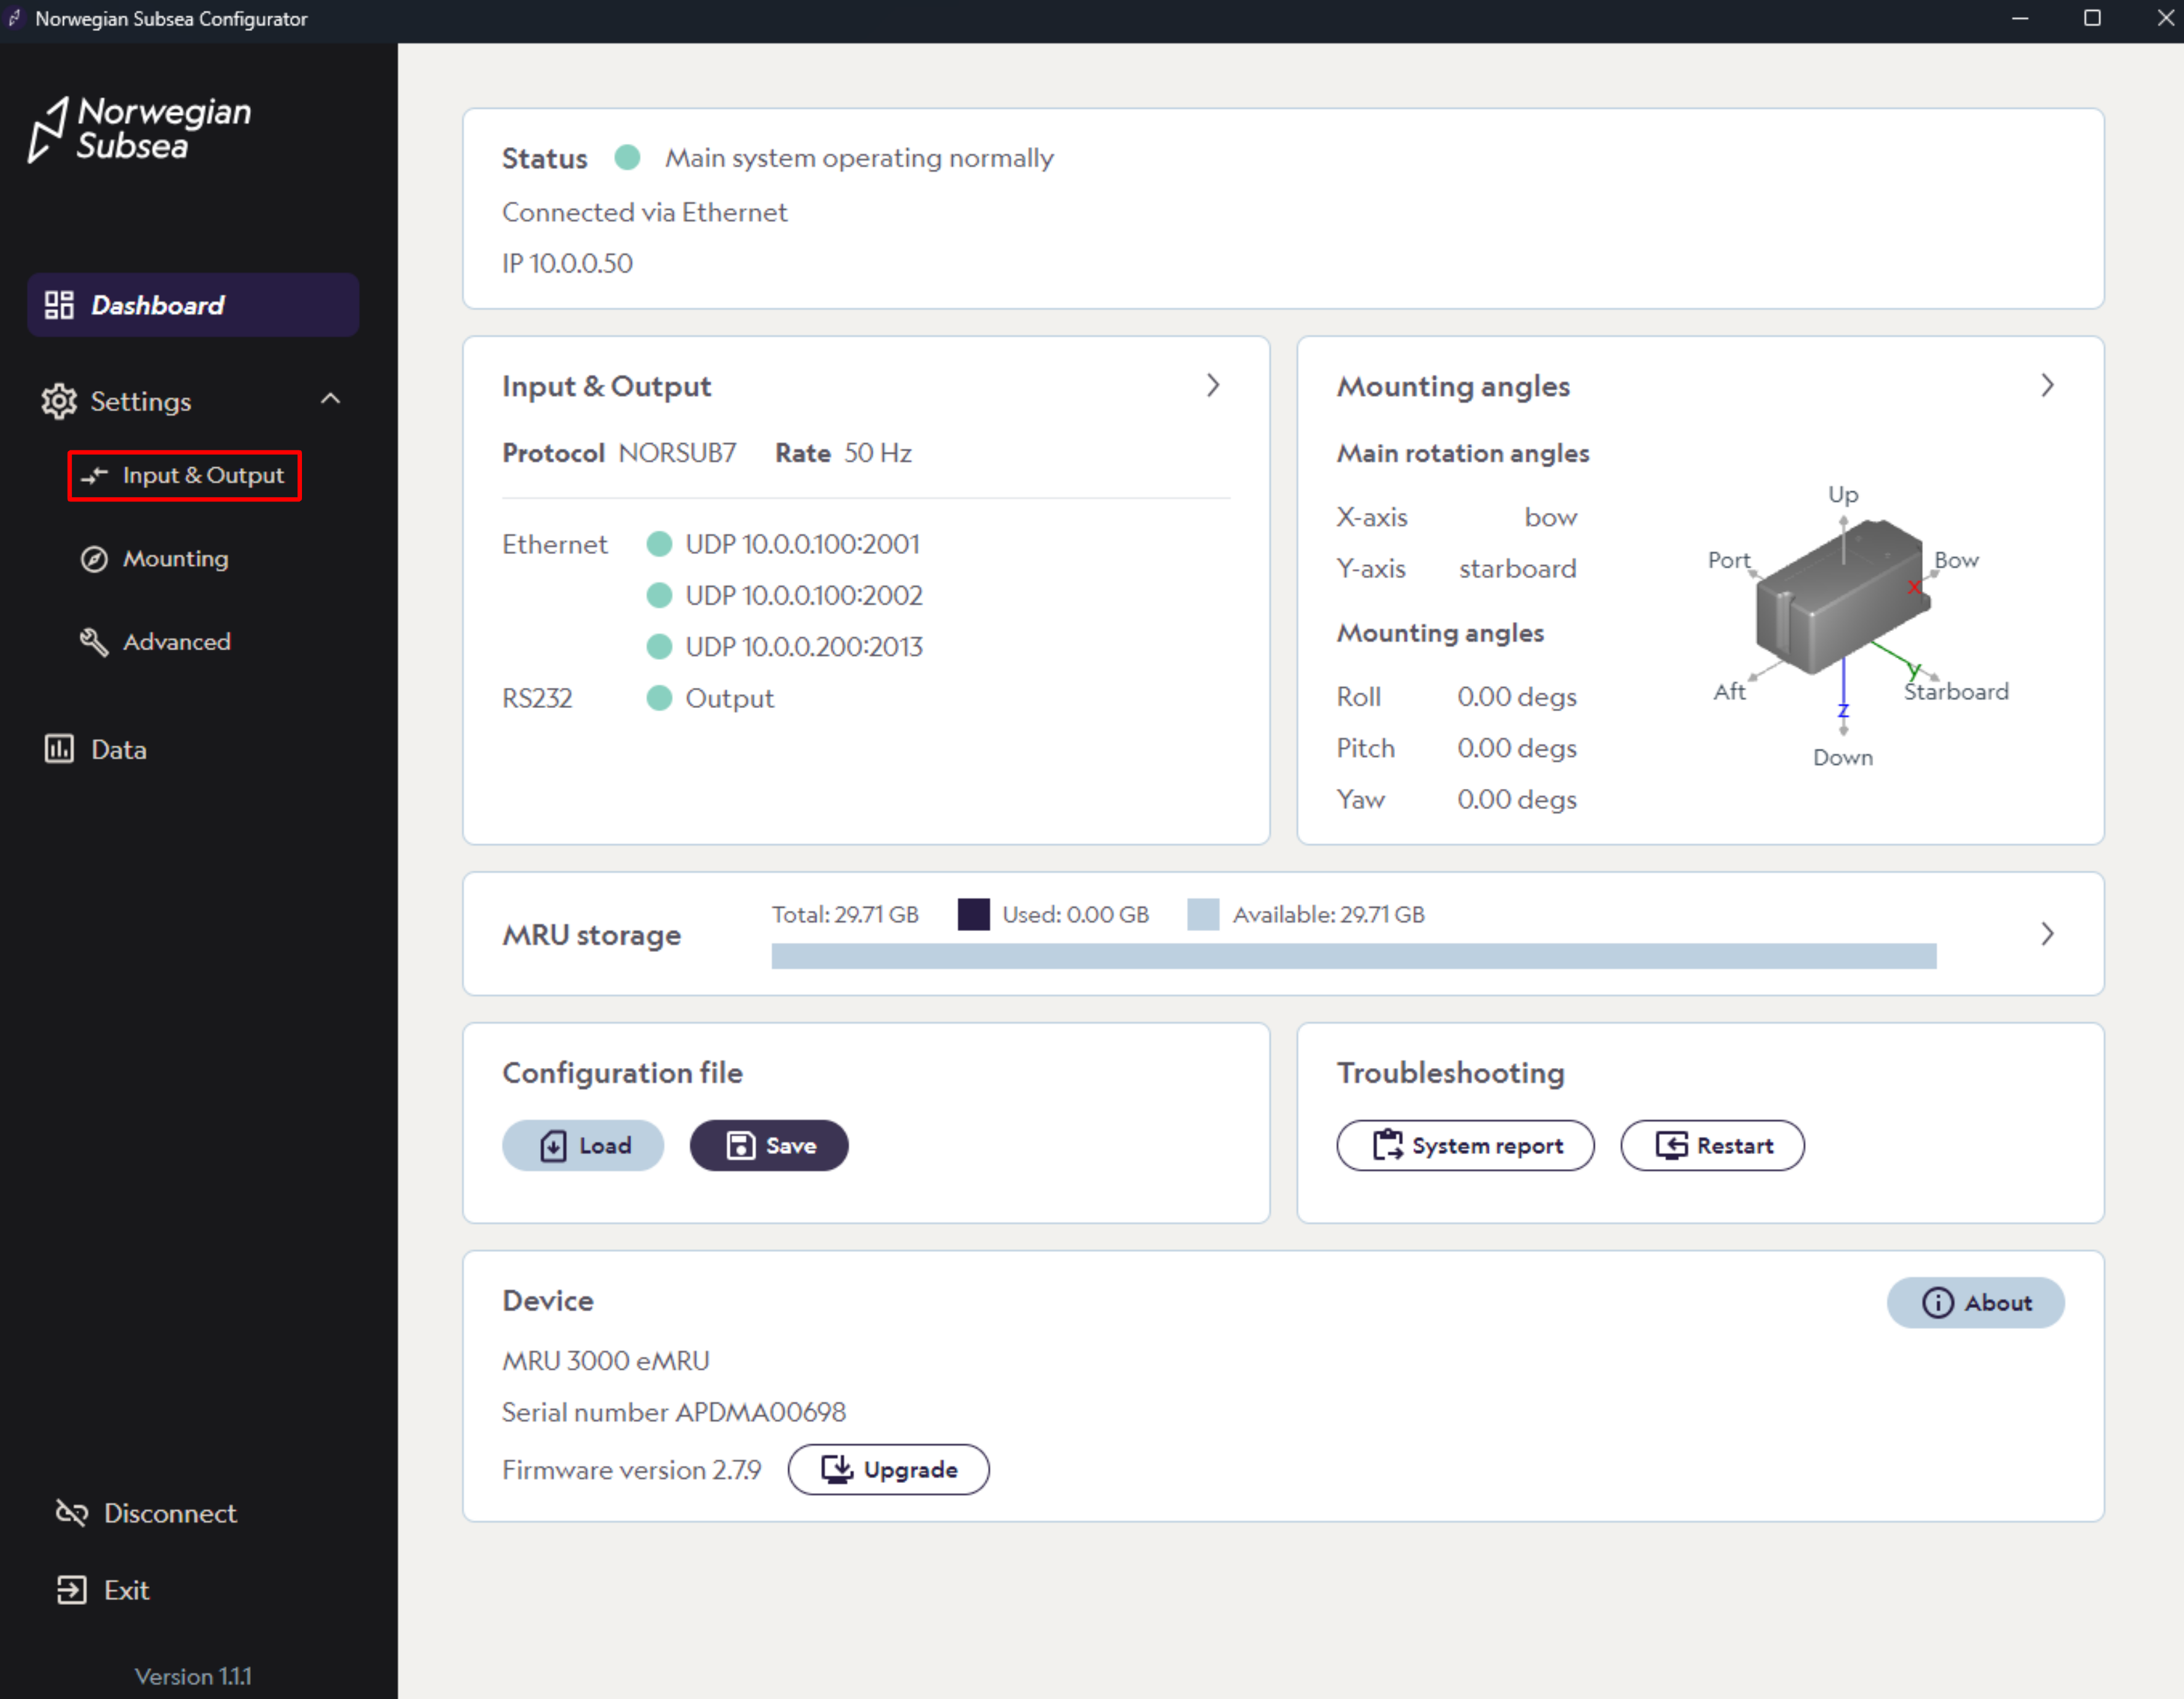
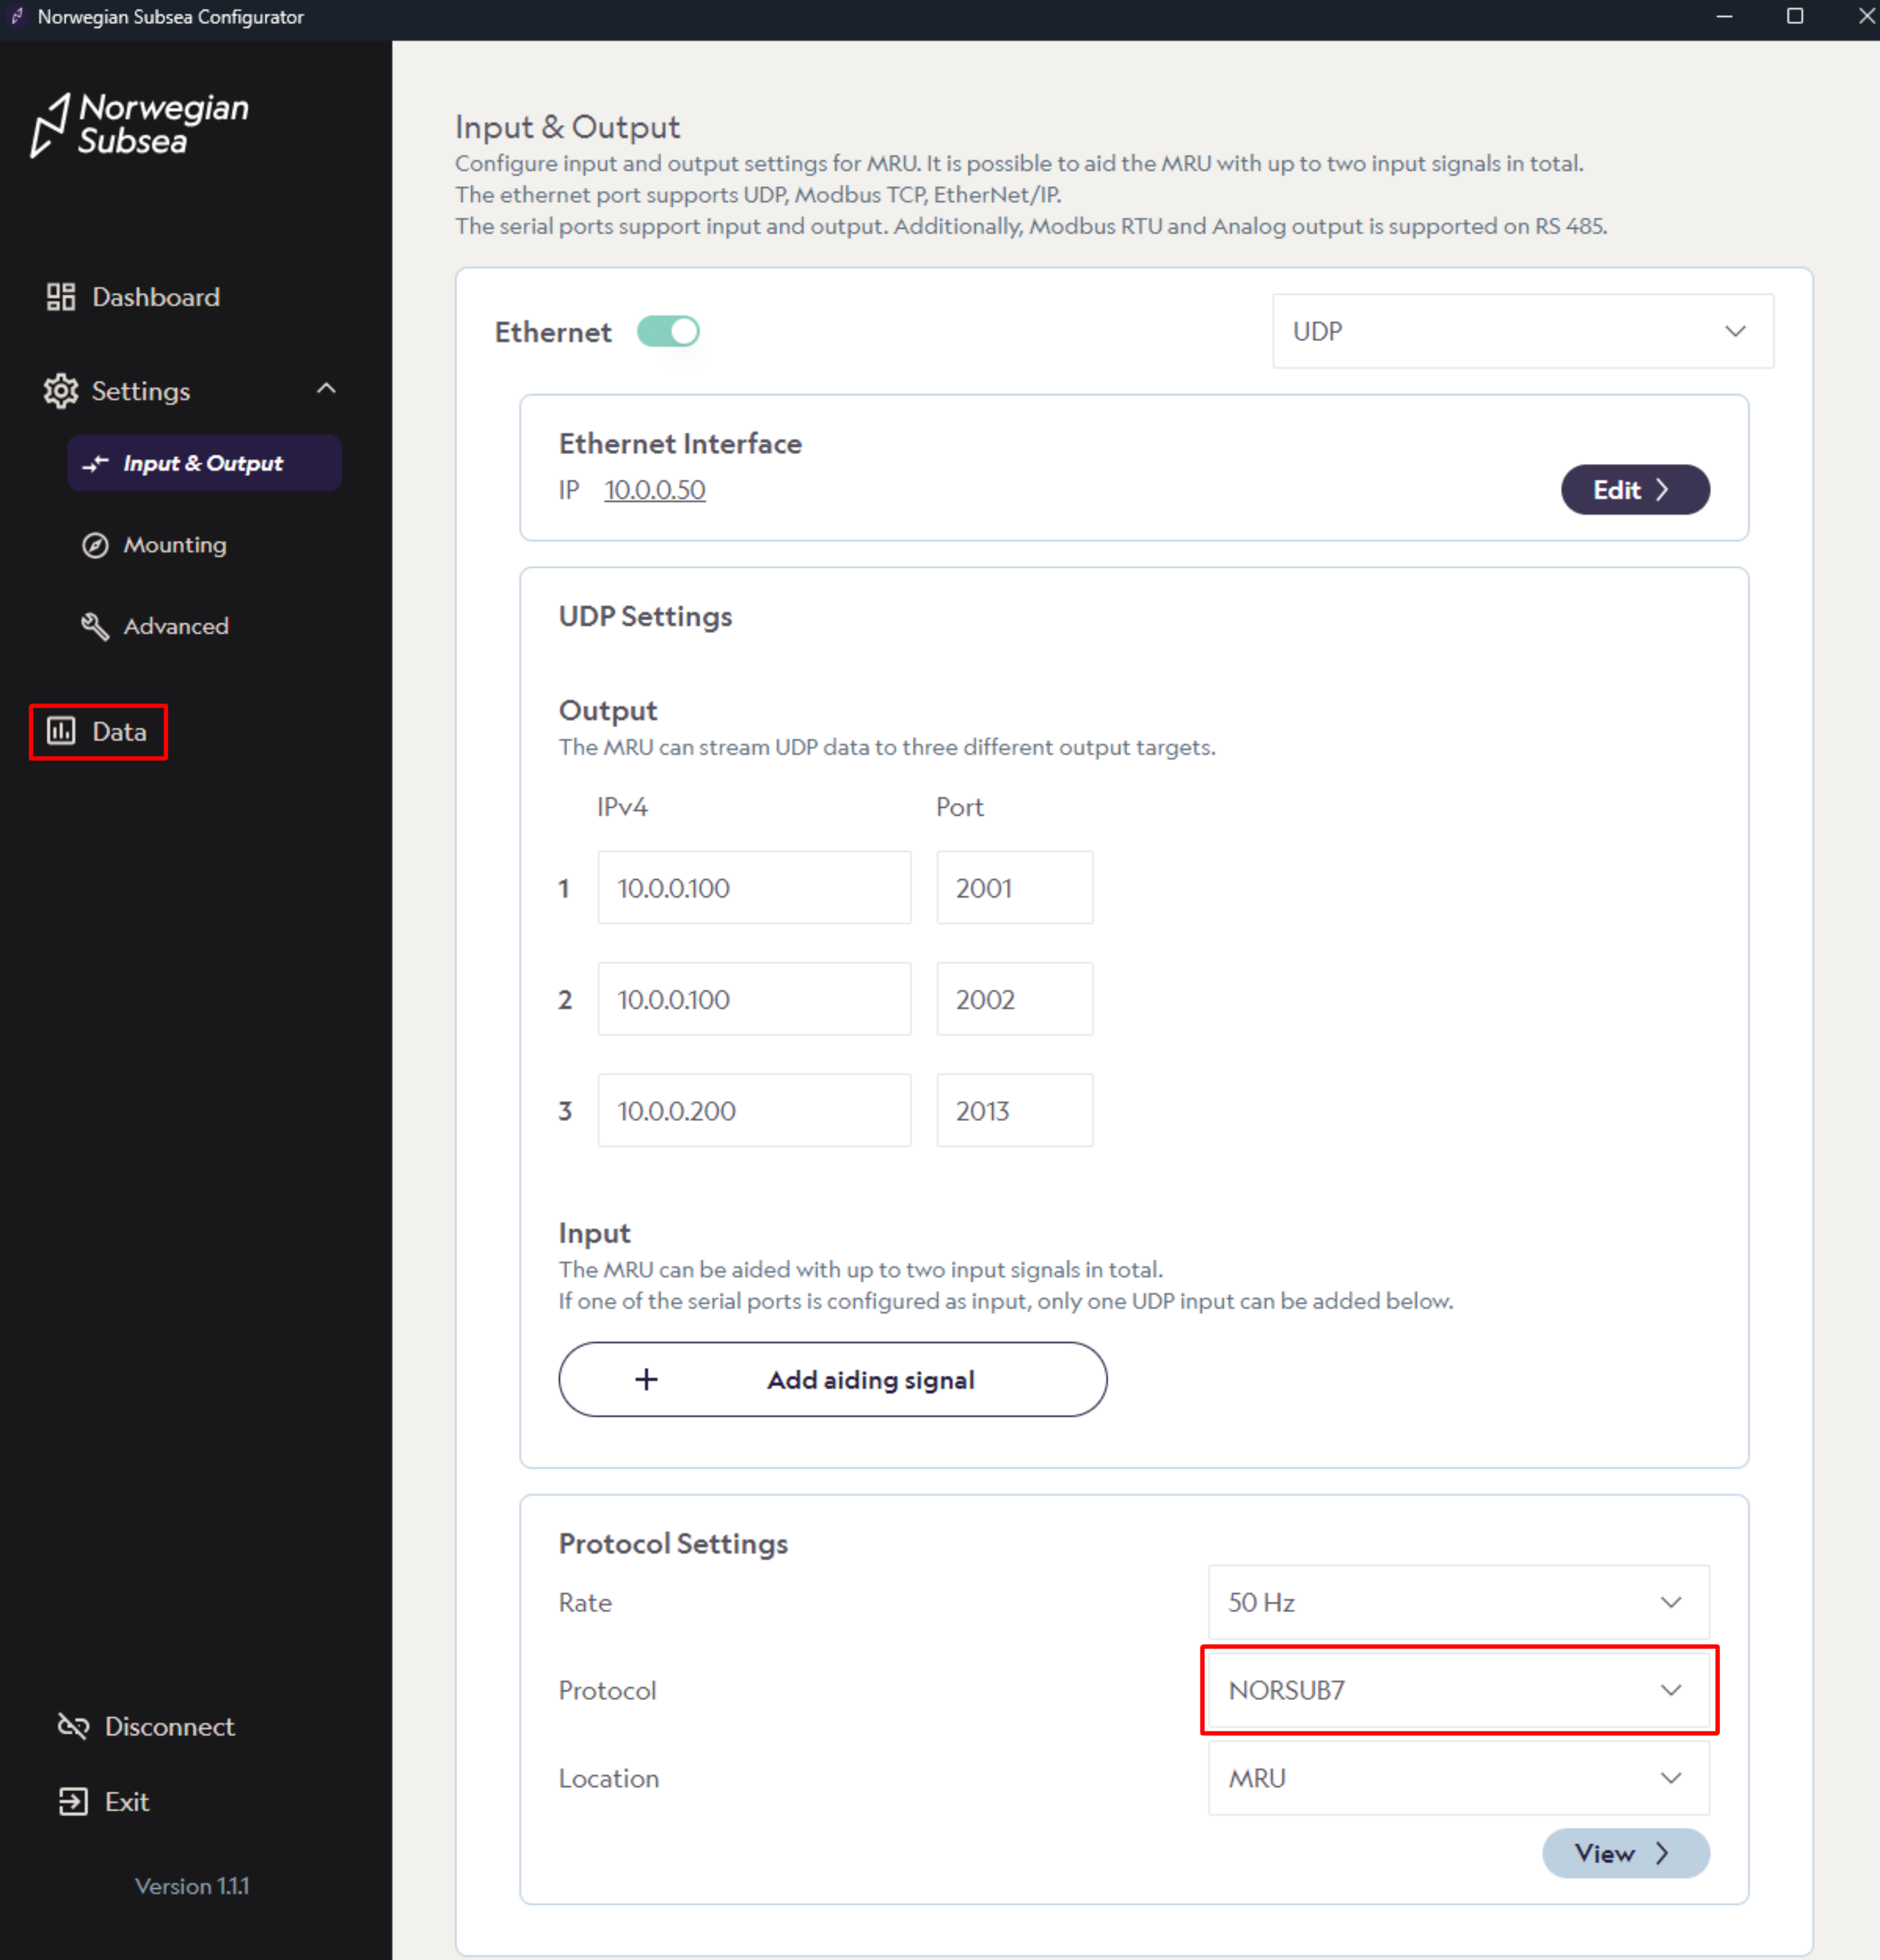
To view the health status, select an output protocol that includes the MRU status bits (e.g., NORSUB7).
Then click “Data“ in the left bar.
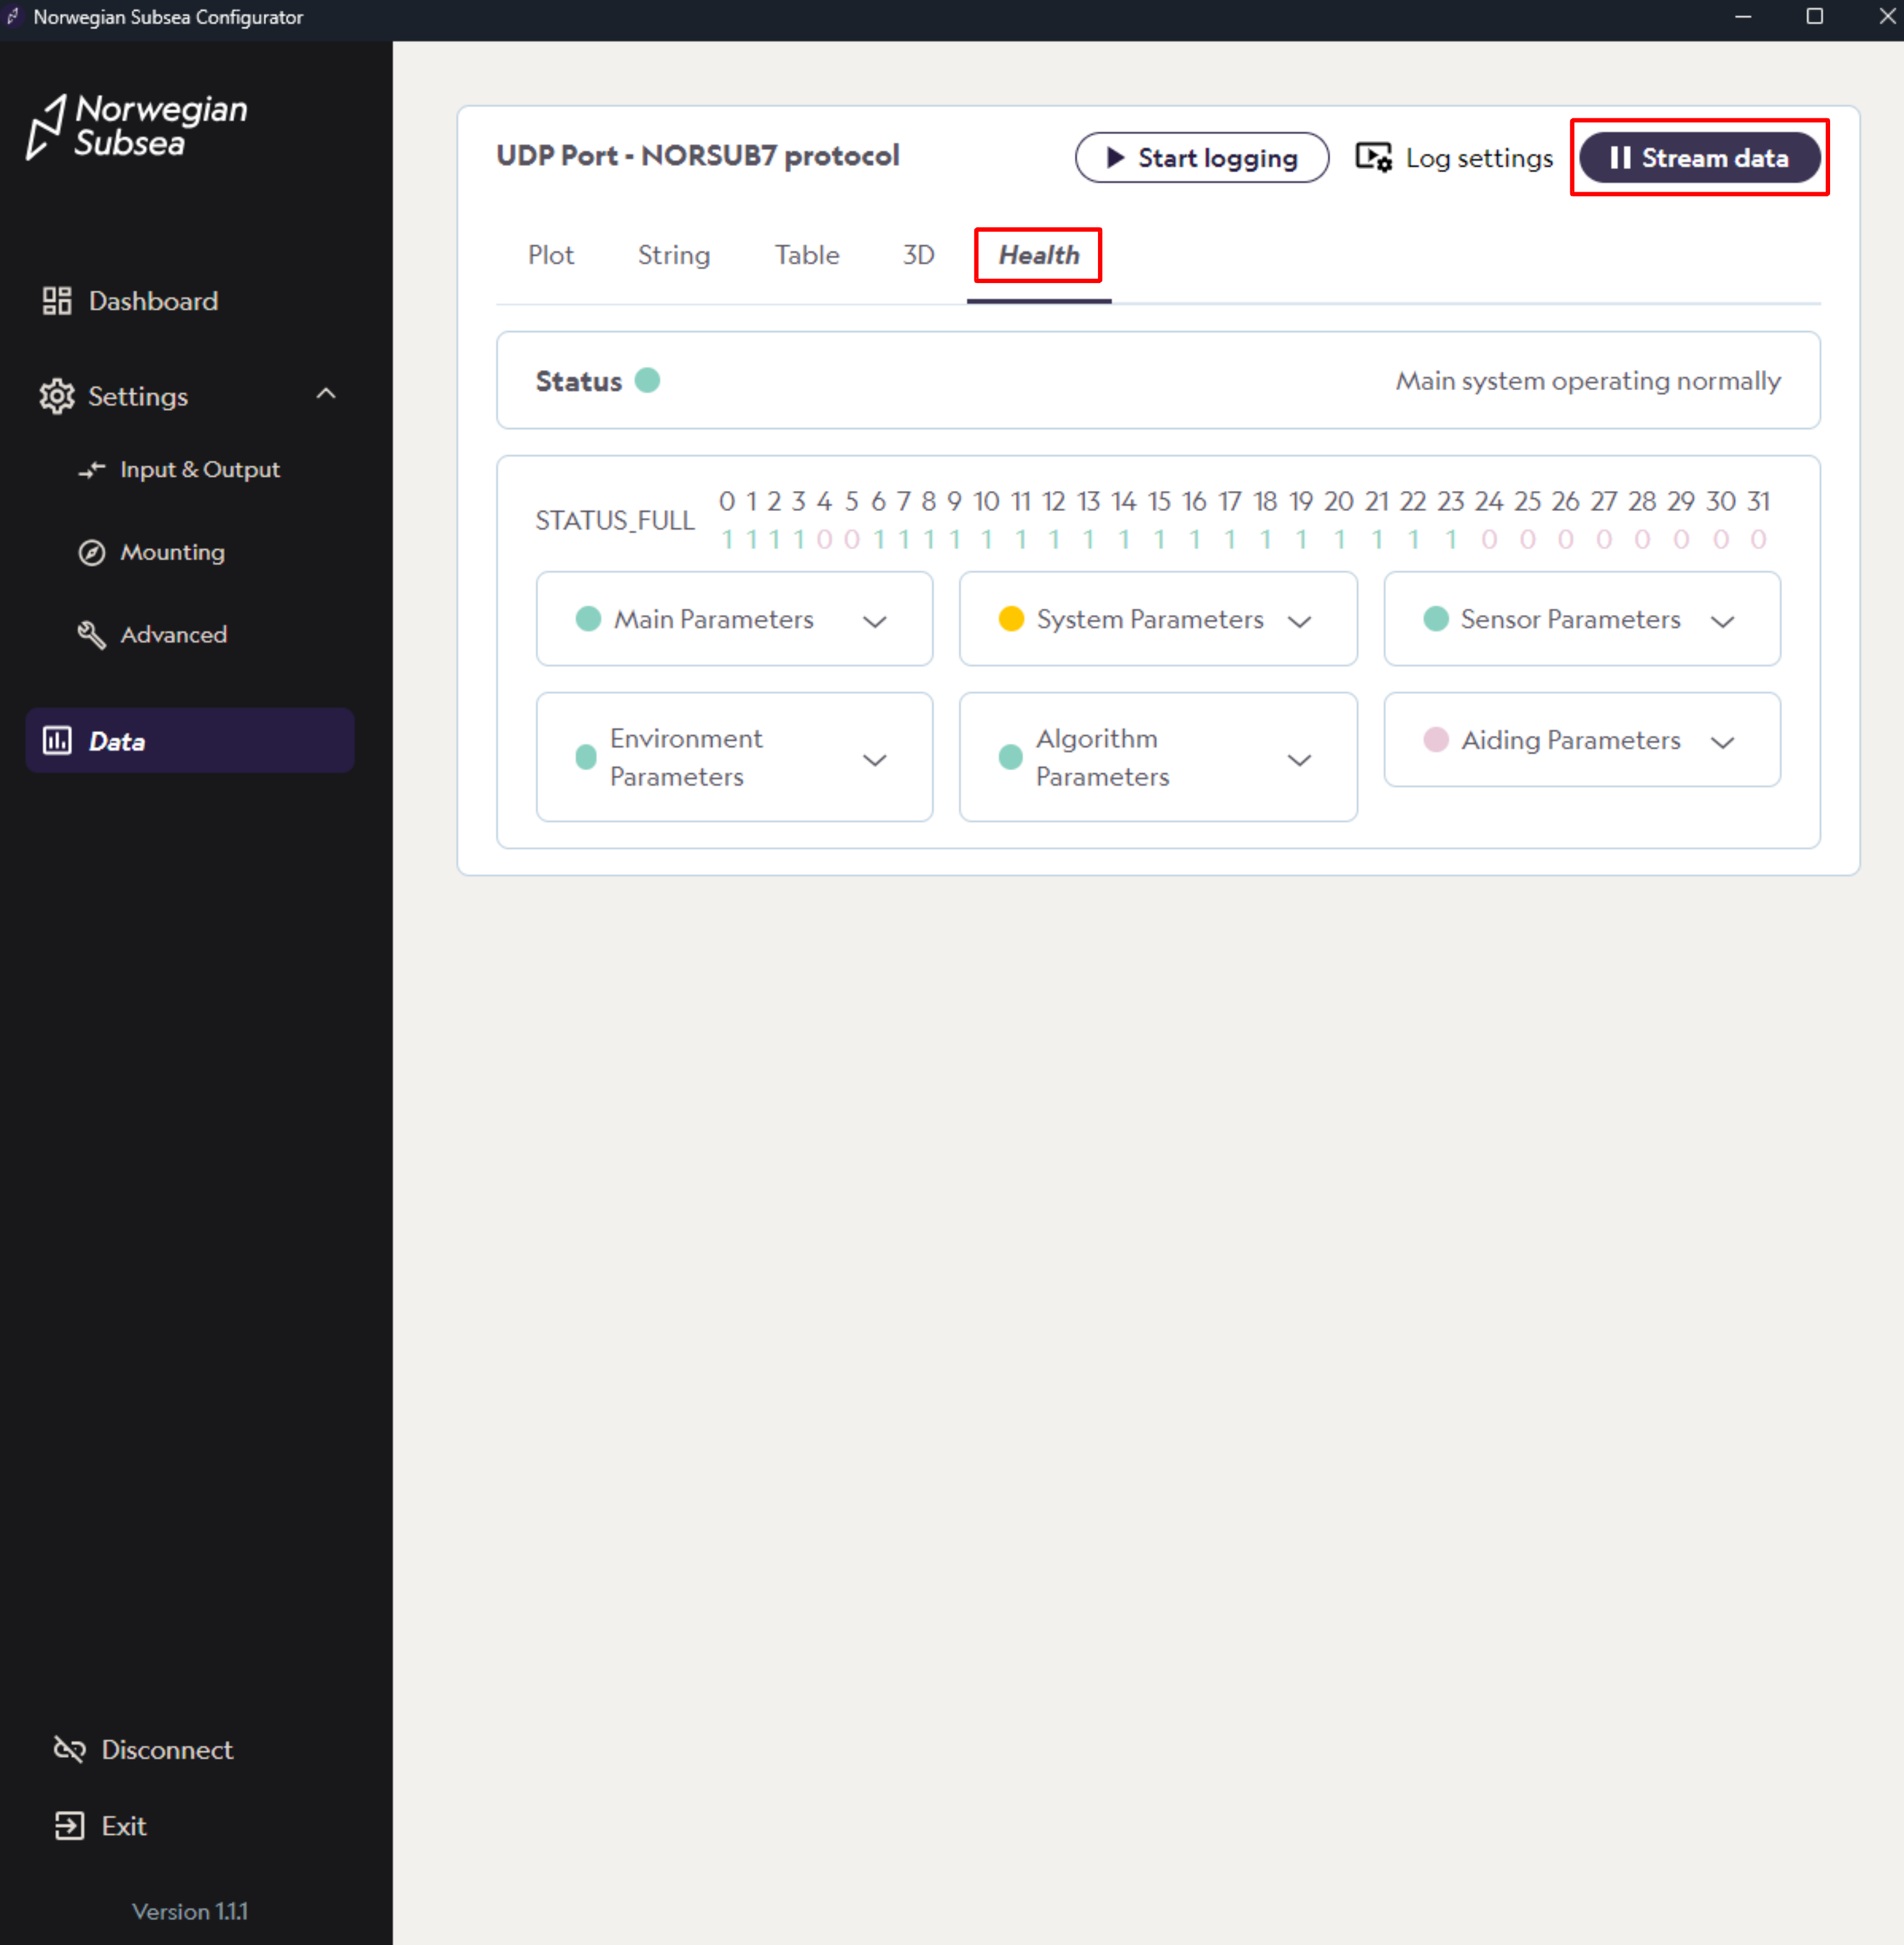
On the data page, click “Stream data“.
Then click on the Health button
You will see an overview of the system health status bits, grouped into six categories: Main, system, sensor, environment, algorithm and aiding. You can click on any category to view a detailed list of the associated status bits.
Each category is color-coded to indicate its overall health:
Green: All health bits within its category are true
Orange: Parts of the health bits within its category are false
Red: All health bits within its category are false
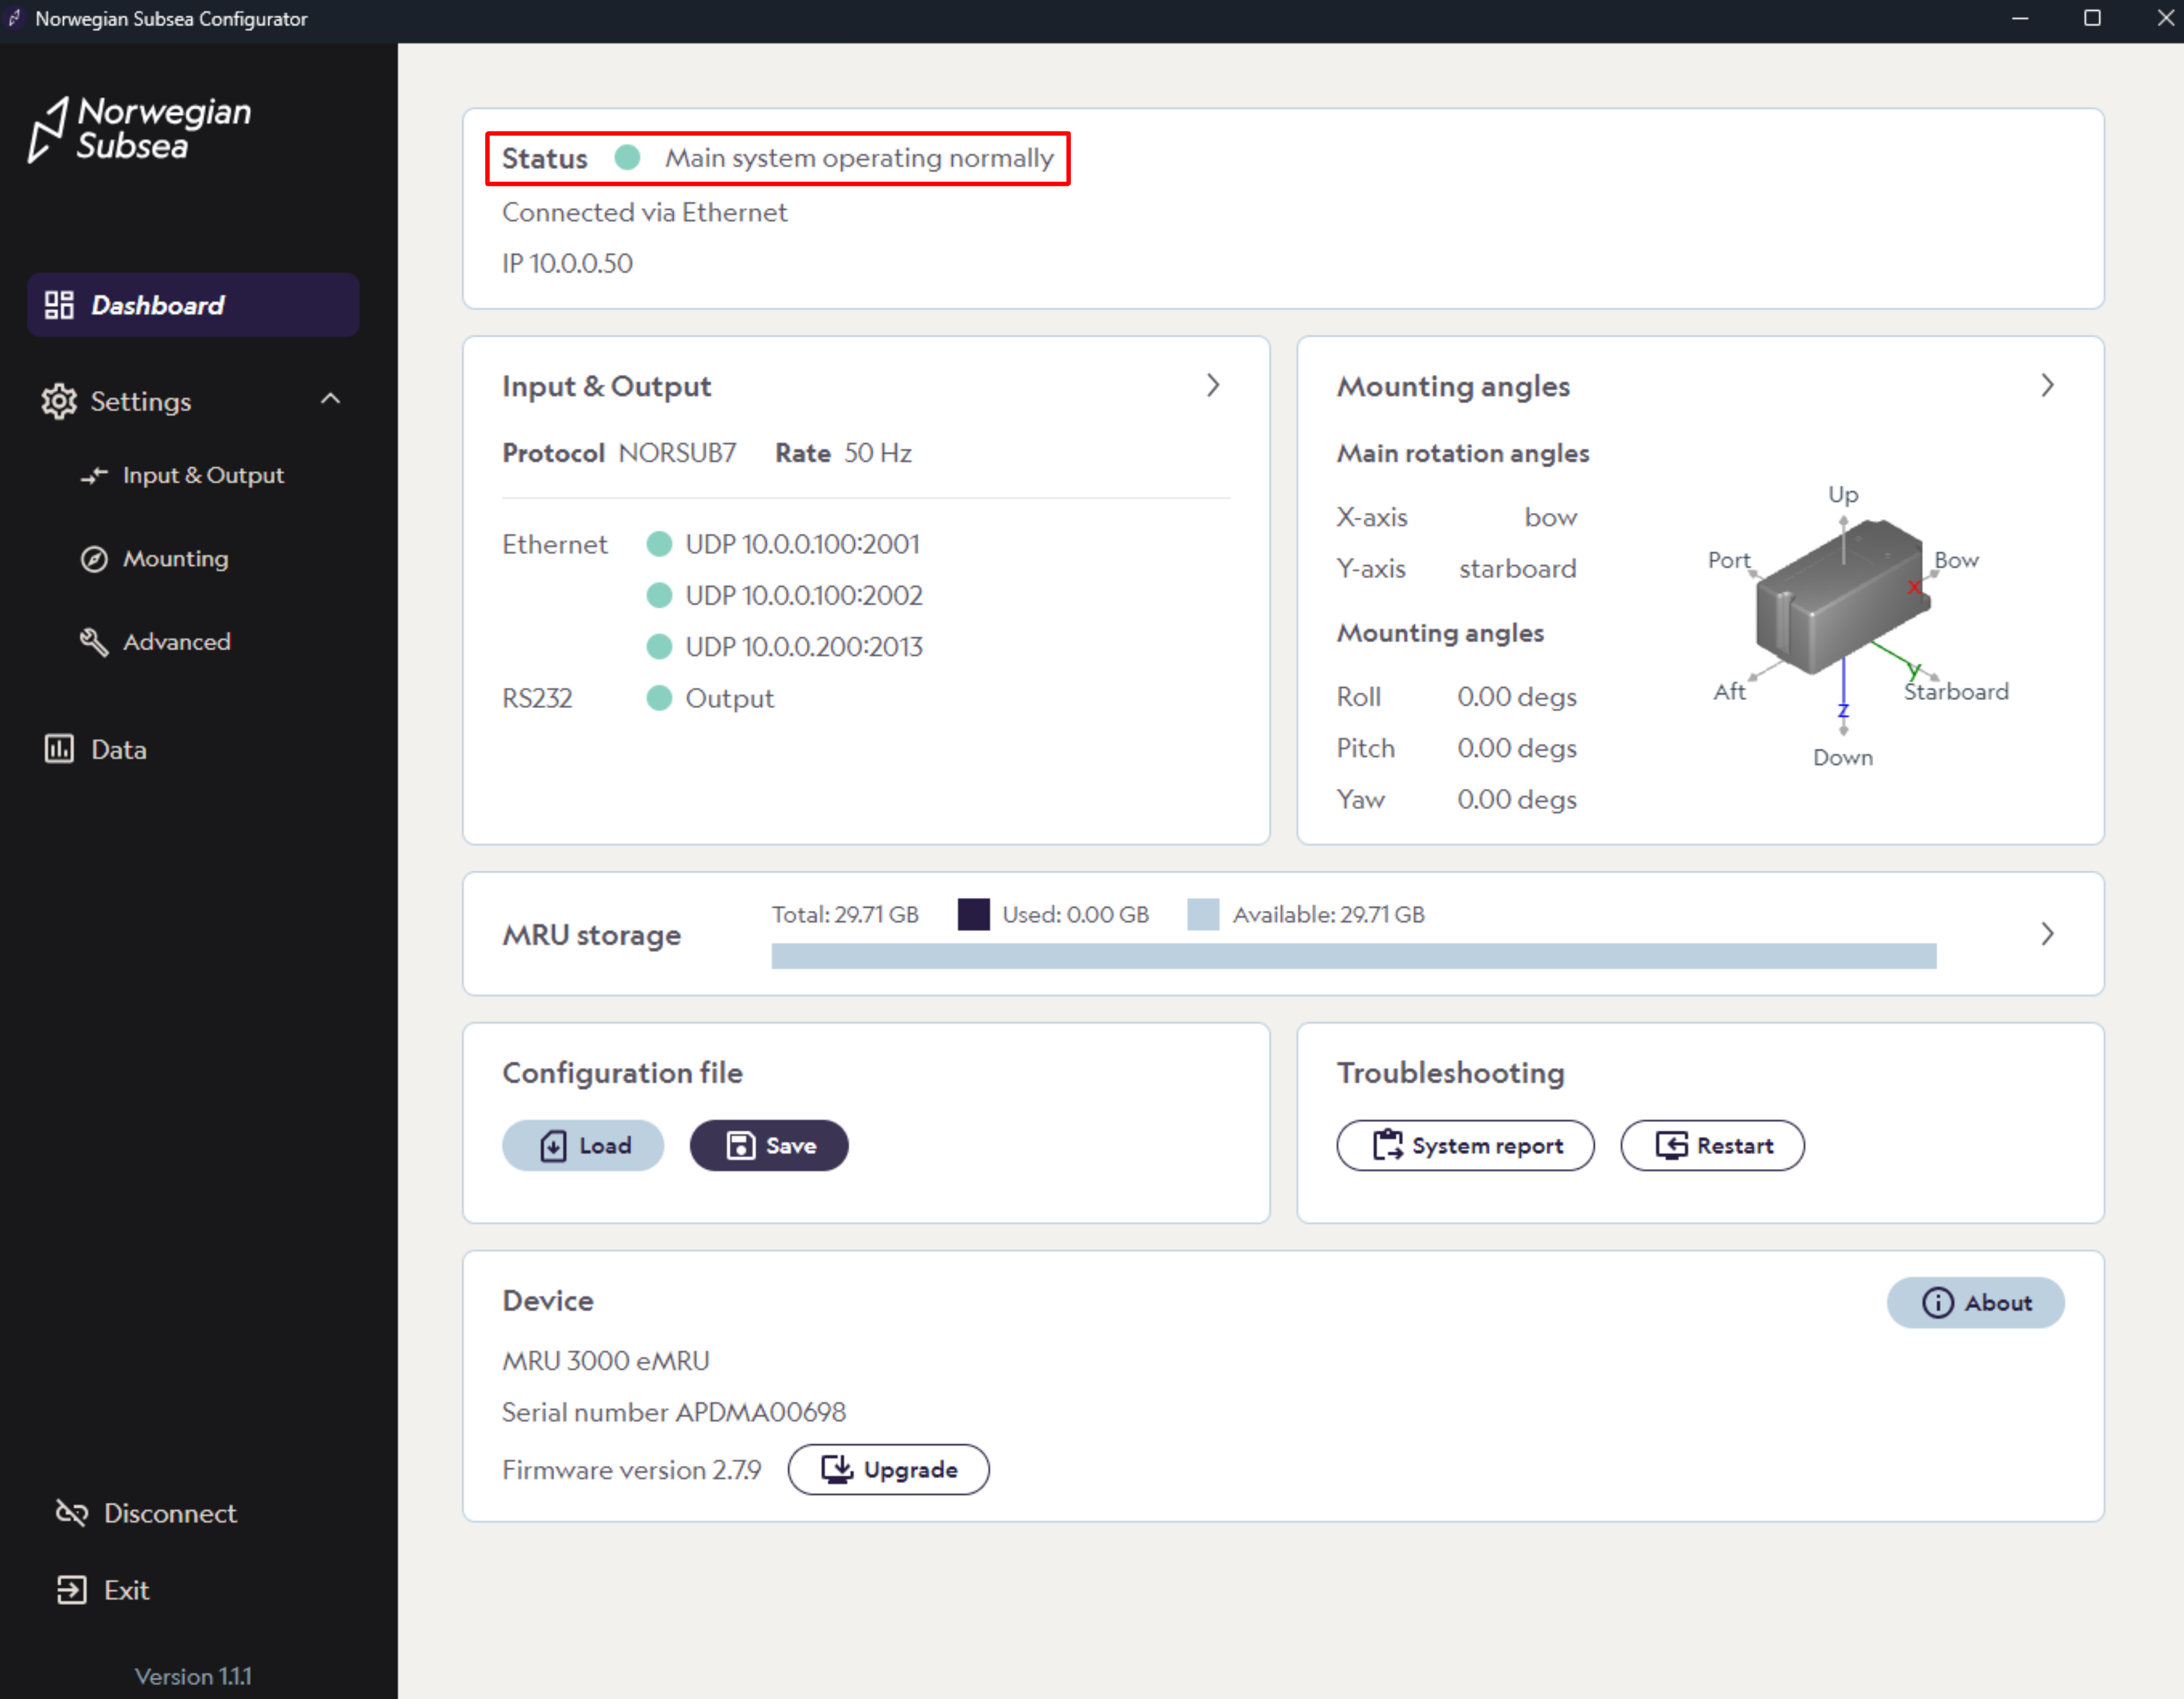
The top section of the main dashboard displays the main status indicator, summarizing whether the system has any active warnings, errors, or signs of performance degradation.
Note that the health status bits are updated in real-time. For more details about the health bits, see our API documentation.
MRU status view
The MRU status view depend on the output protocol: some do not include status data, while some carry partial or full status information.