This guide provides step-by-step instructions for configuring output data on your device, as well as streaming and logging for verification. It covers the following key areas:
-
Configuration: How to set up output data over the selected communication protocol.
-
Streaming and Visualization: How to stream the configured data and visualize it in real-time.
-
Logging: How to configure log settings, and start and stop data logging efficiently.
Note
This example uses UDP over Ethernet as the communication protocol. While other protocols such as MODBUS TCP, Ethernet/IP, RS-232, and RS-485 follow a similar workflow, their configuration parameters may differ.
MRU configurator
Before getting started, you must download the Norwegian Subsea Configurator application (MRU configurator).
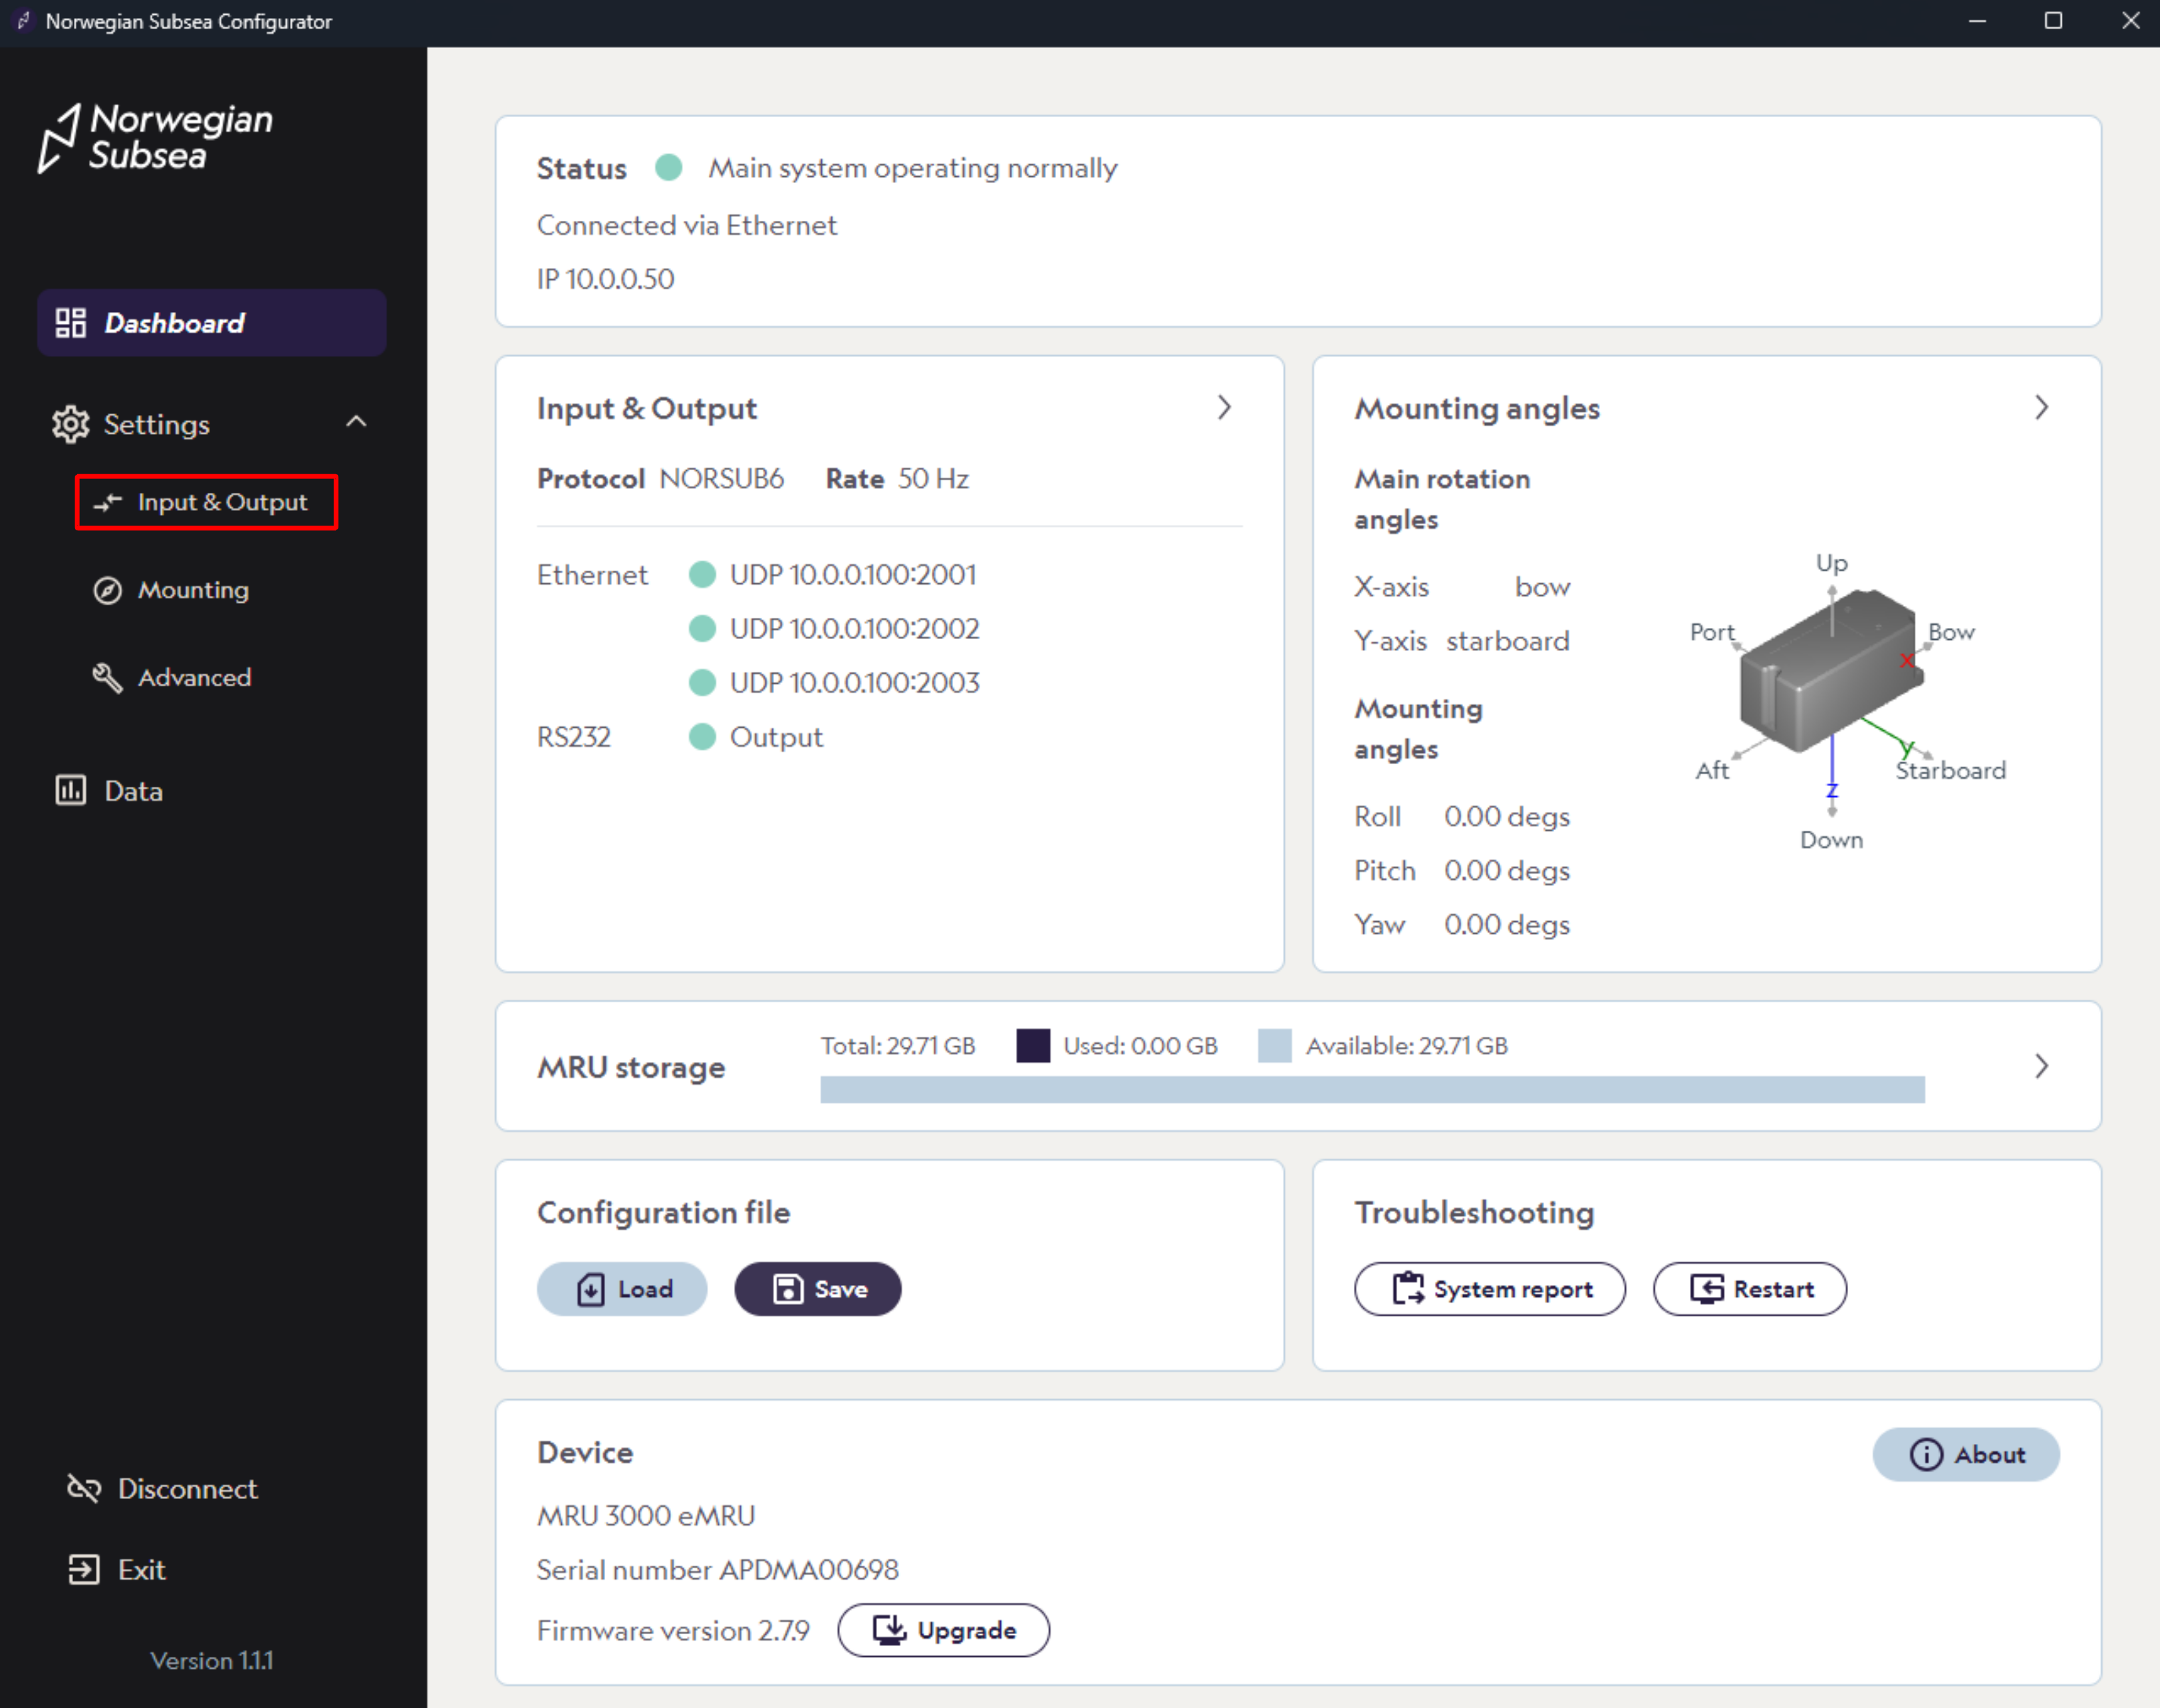
Step 1: Configuration
-
Open the MRU configurator and connect to your MRU
-
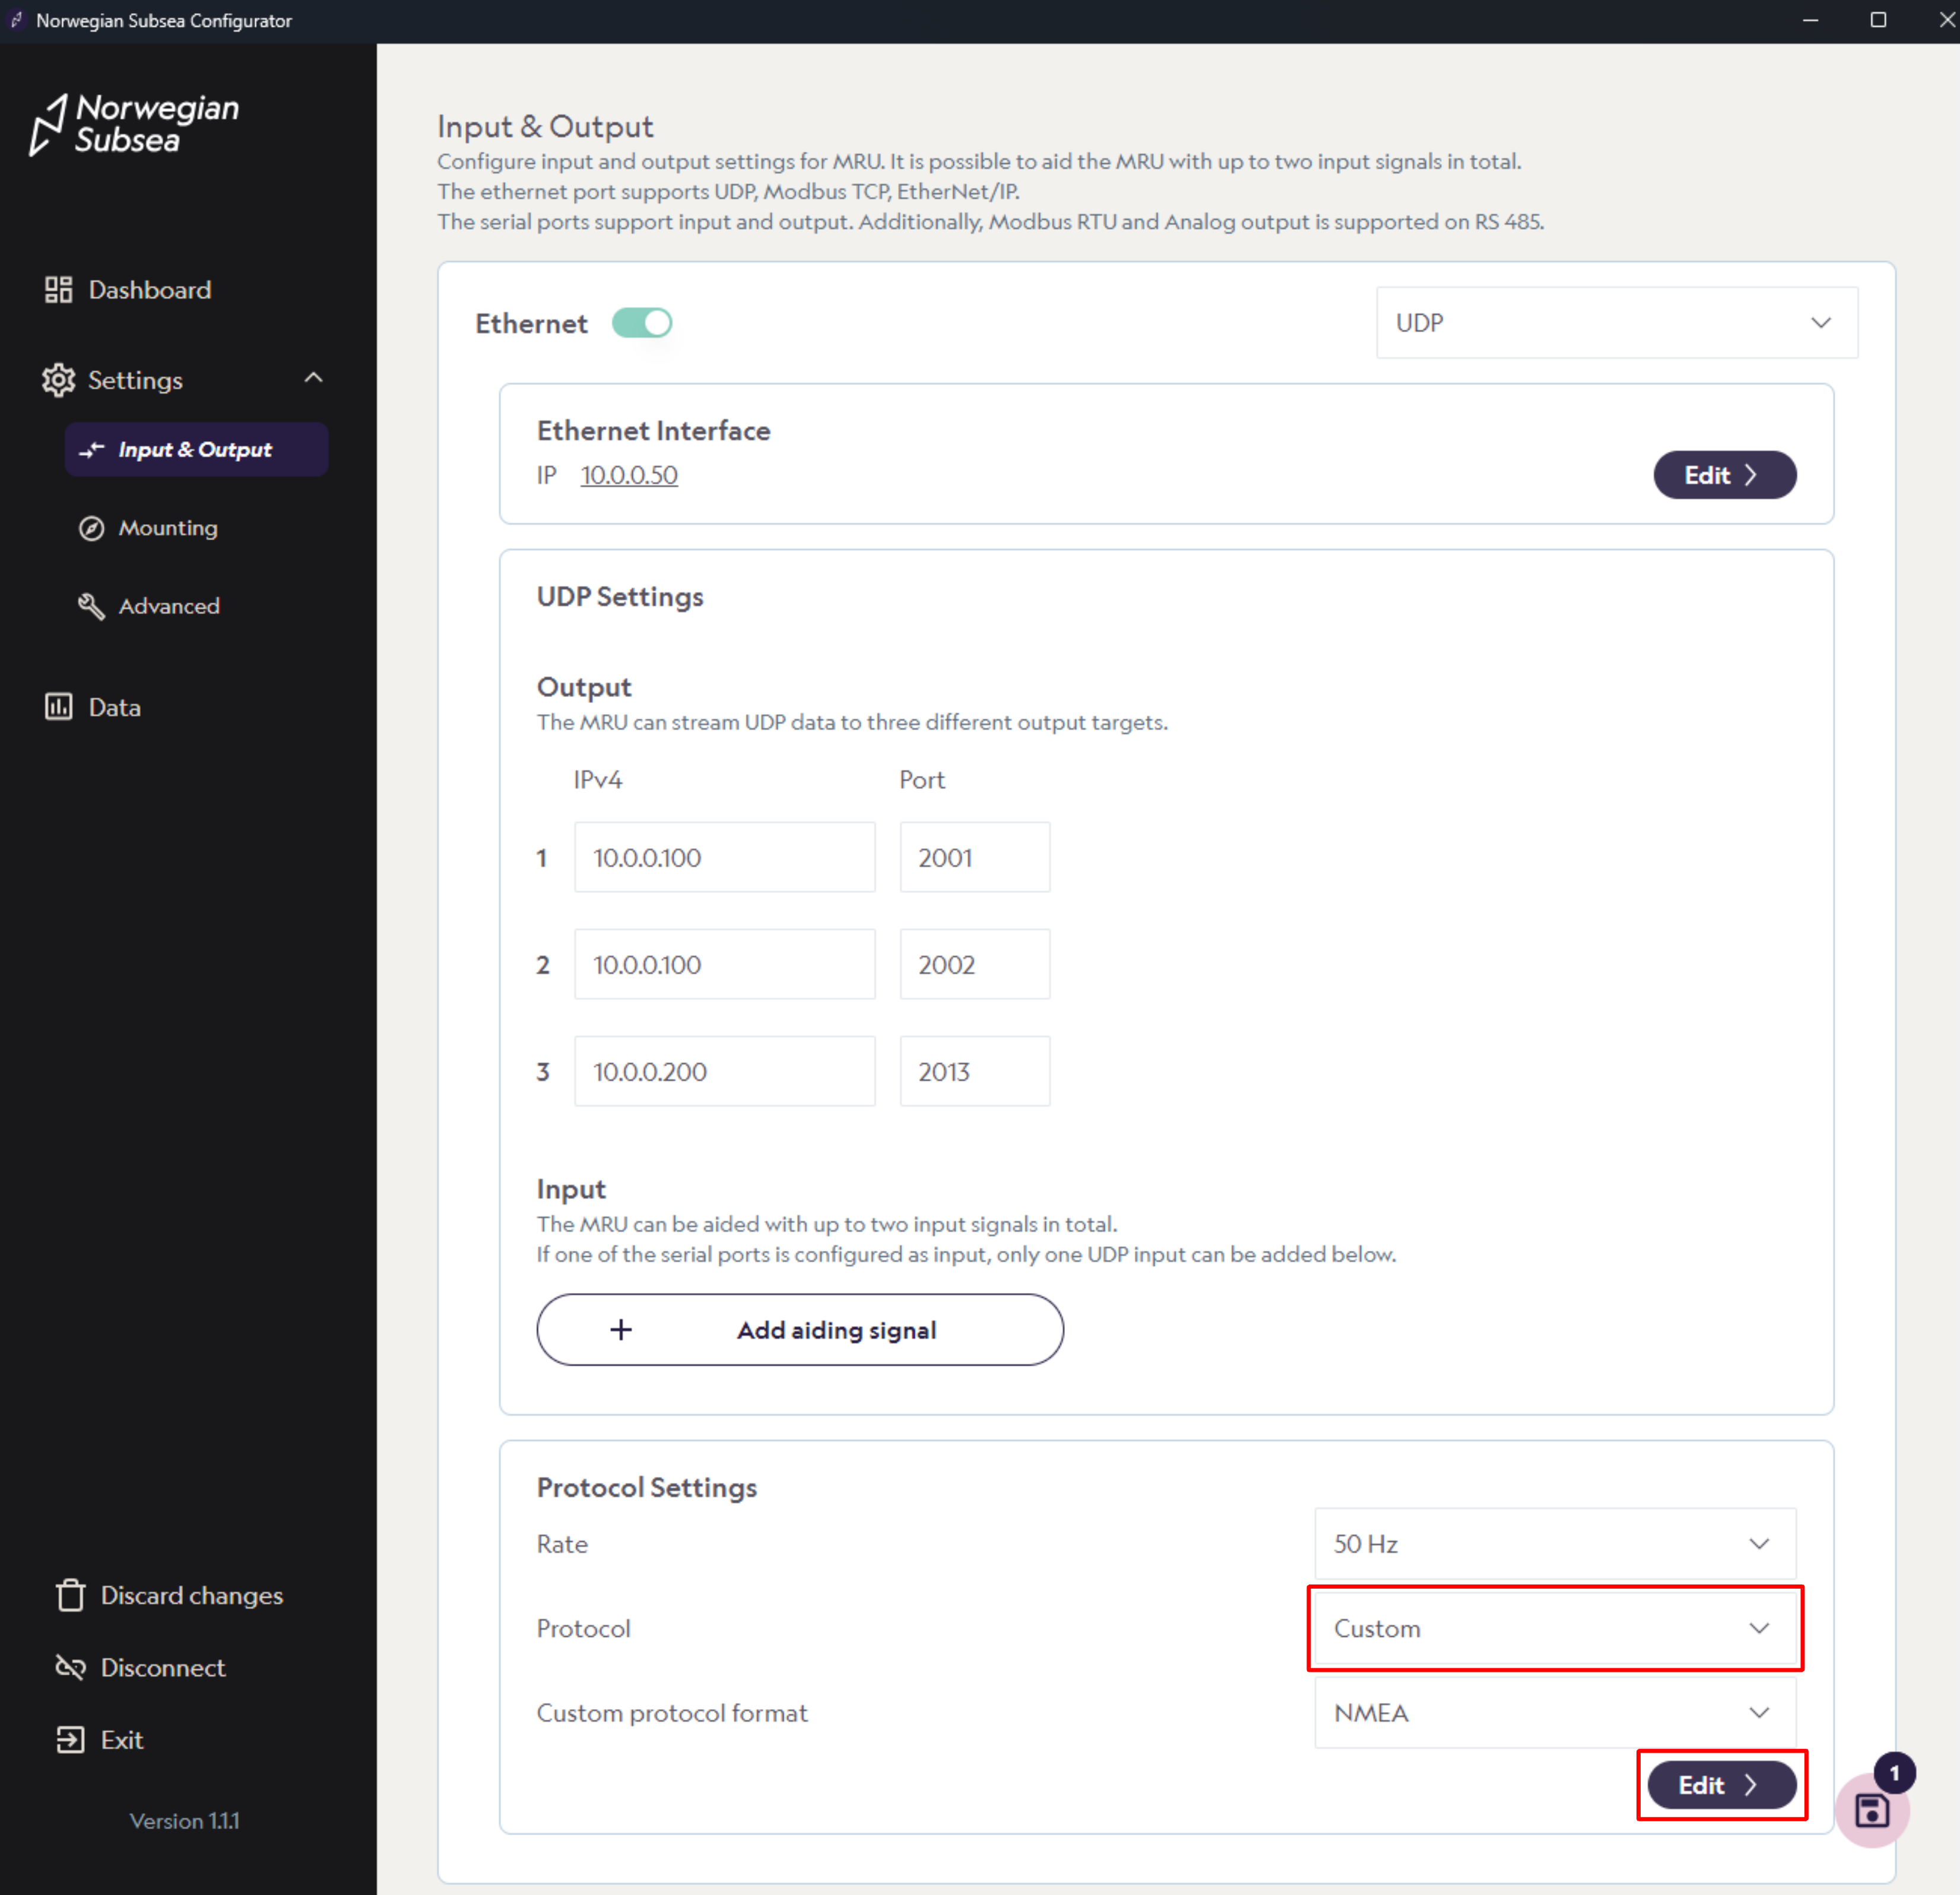
Click “Settings“ -> “Input & Output“ in the left bar
-
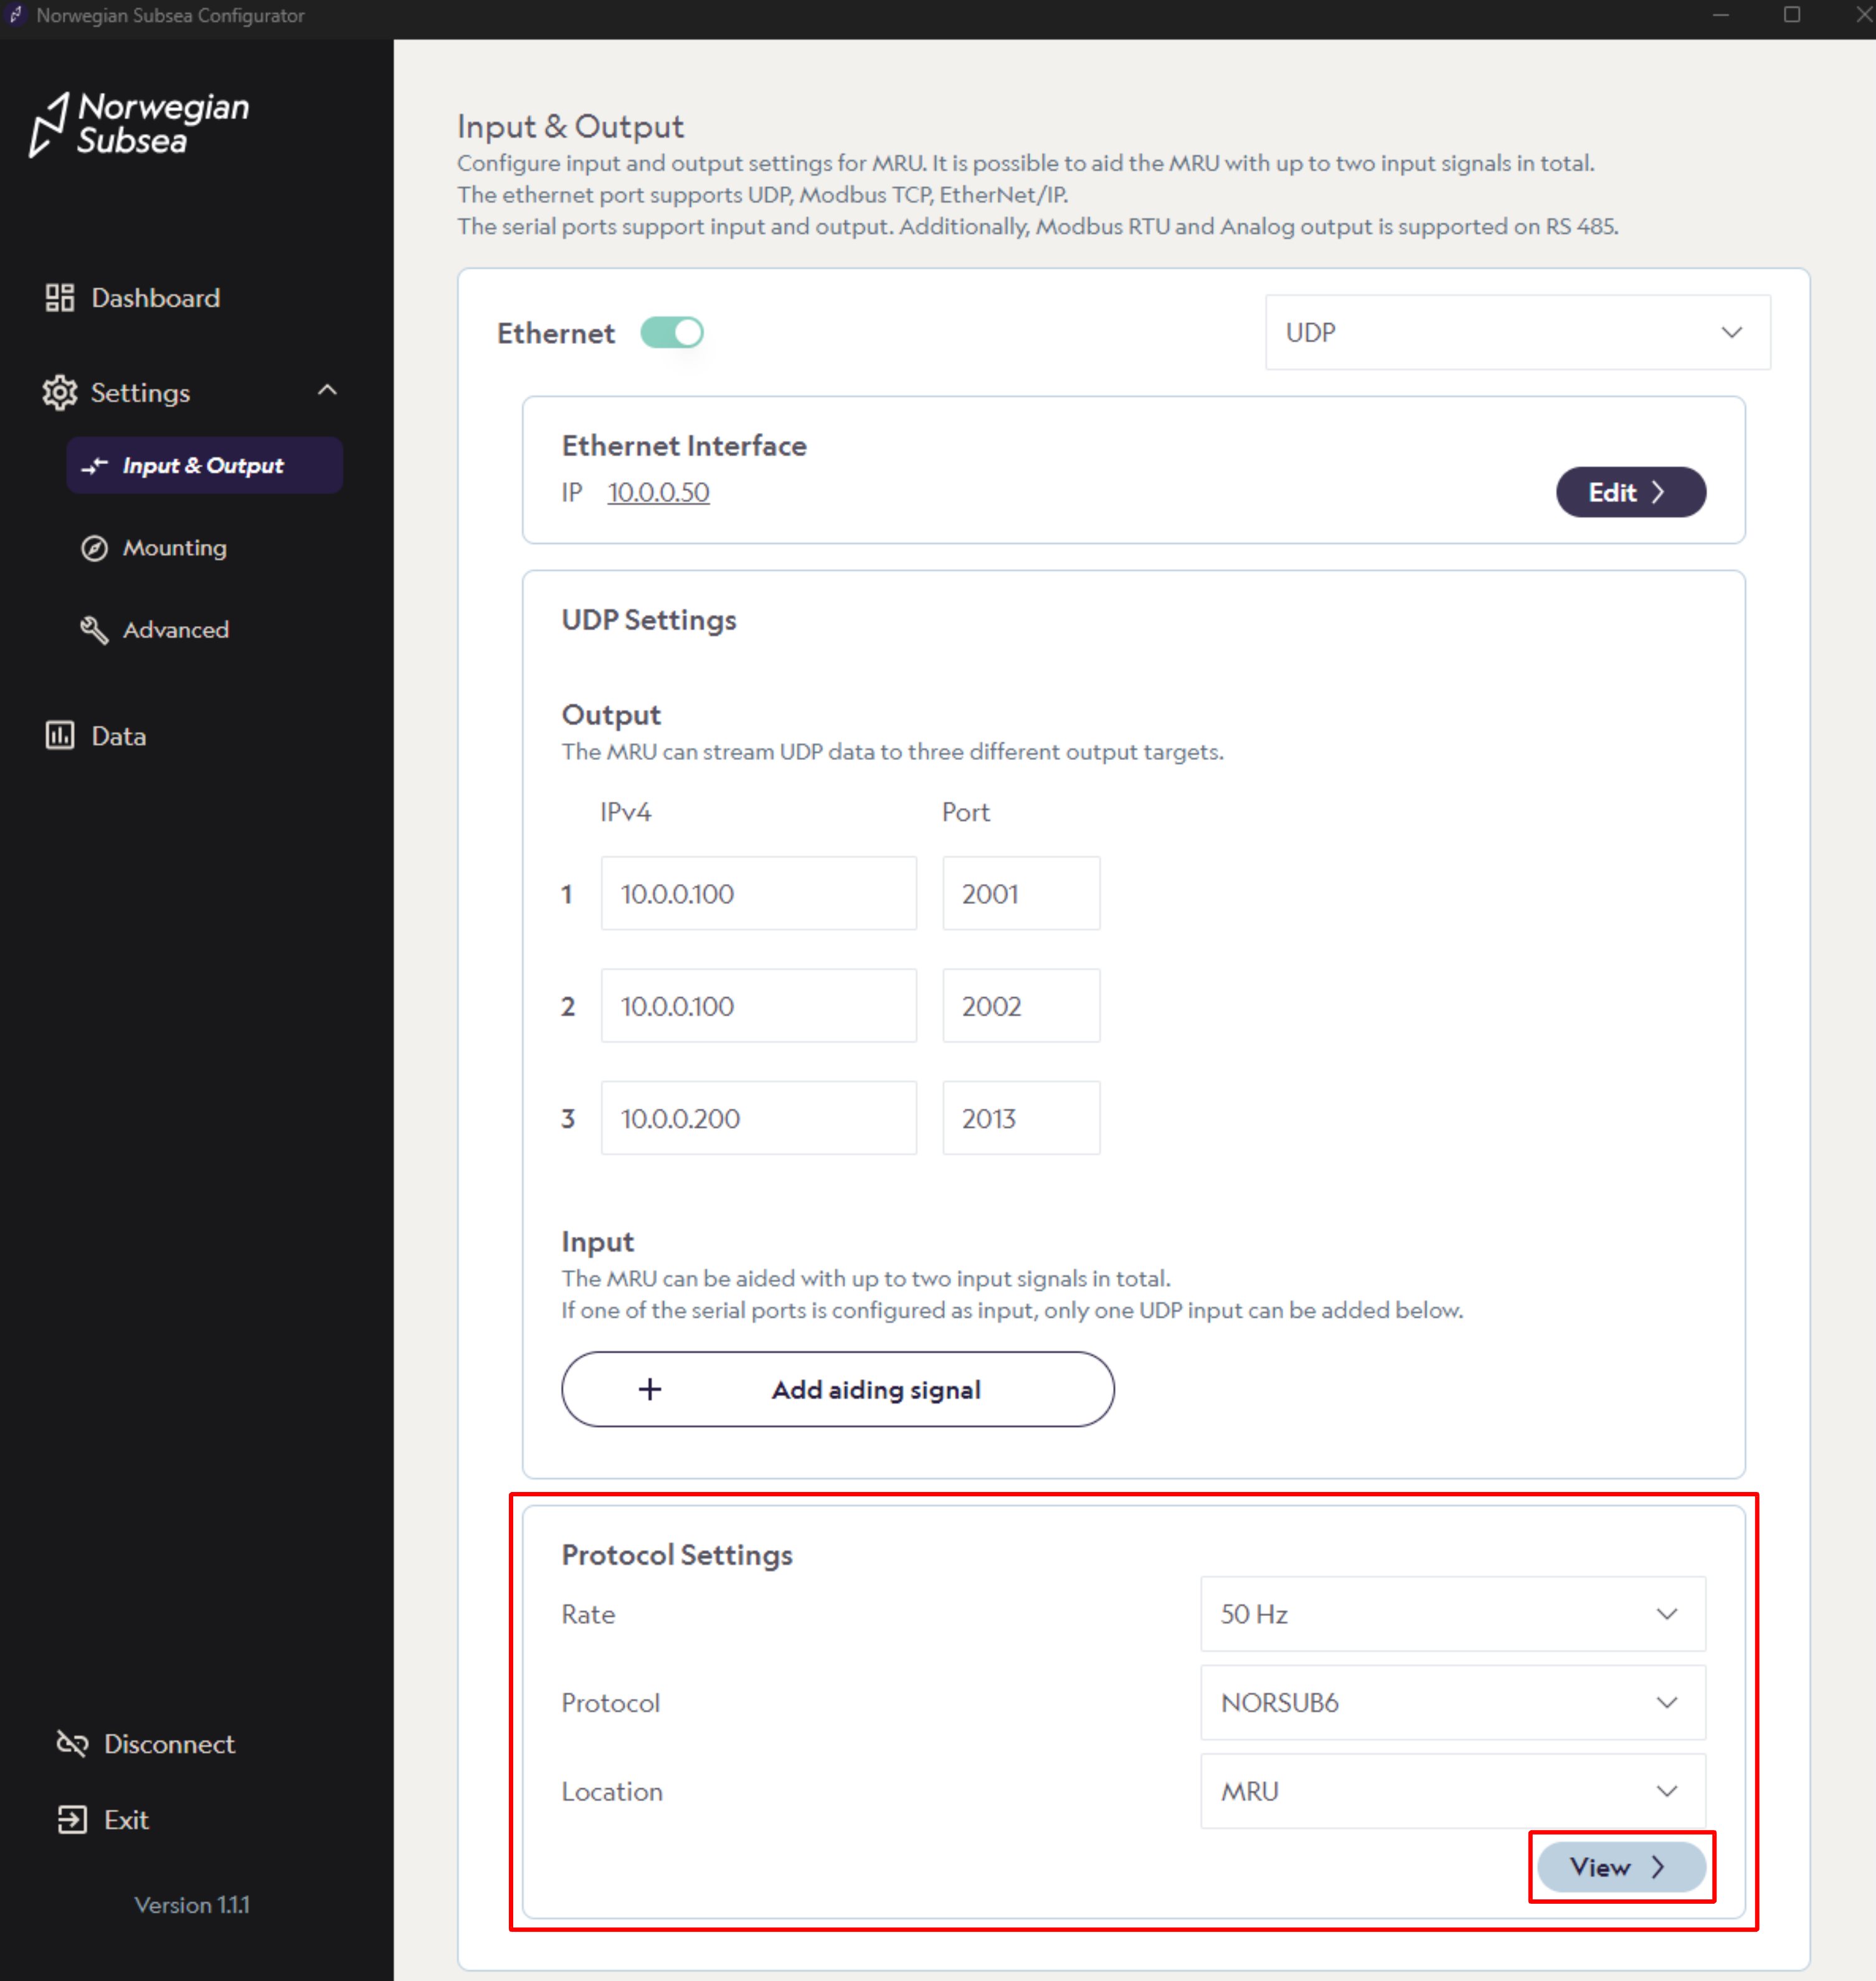
Under the Ethernet section, find protocol settings and configure after your desired needs.
-
For fixed protocols, you can specify the following:
-
Rate: Specify output frequency. Range: 1-100Hz.
-
Protocol: Specify your desired output protocol.
-
Location: Specify location of the MRU output (fixed protocols only).
-
-
Click “View“ to see the content of the chosen protocol
-
For custom protocol, change protocol to “Custom“. Here you can also choose between NMEA and binary data format. You can edit the content of the protocol by clicking “Edit“.
-
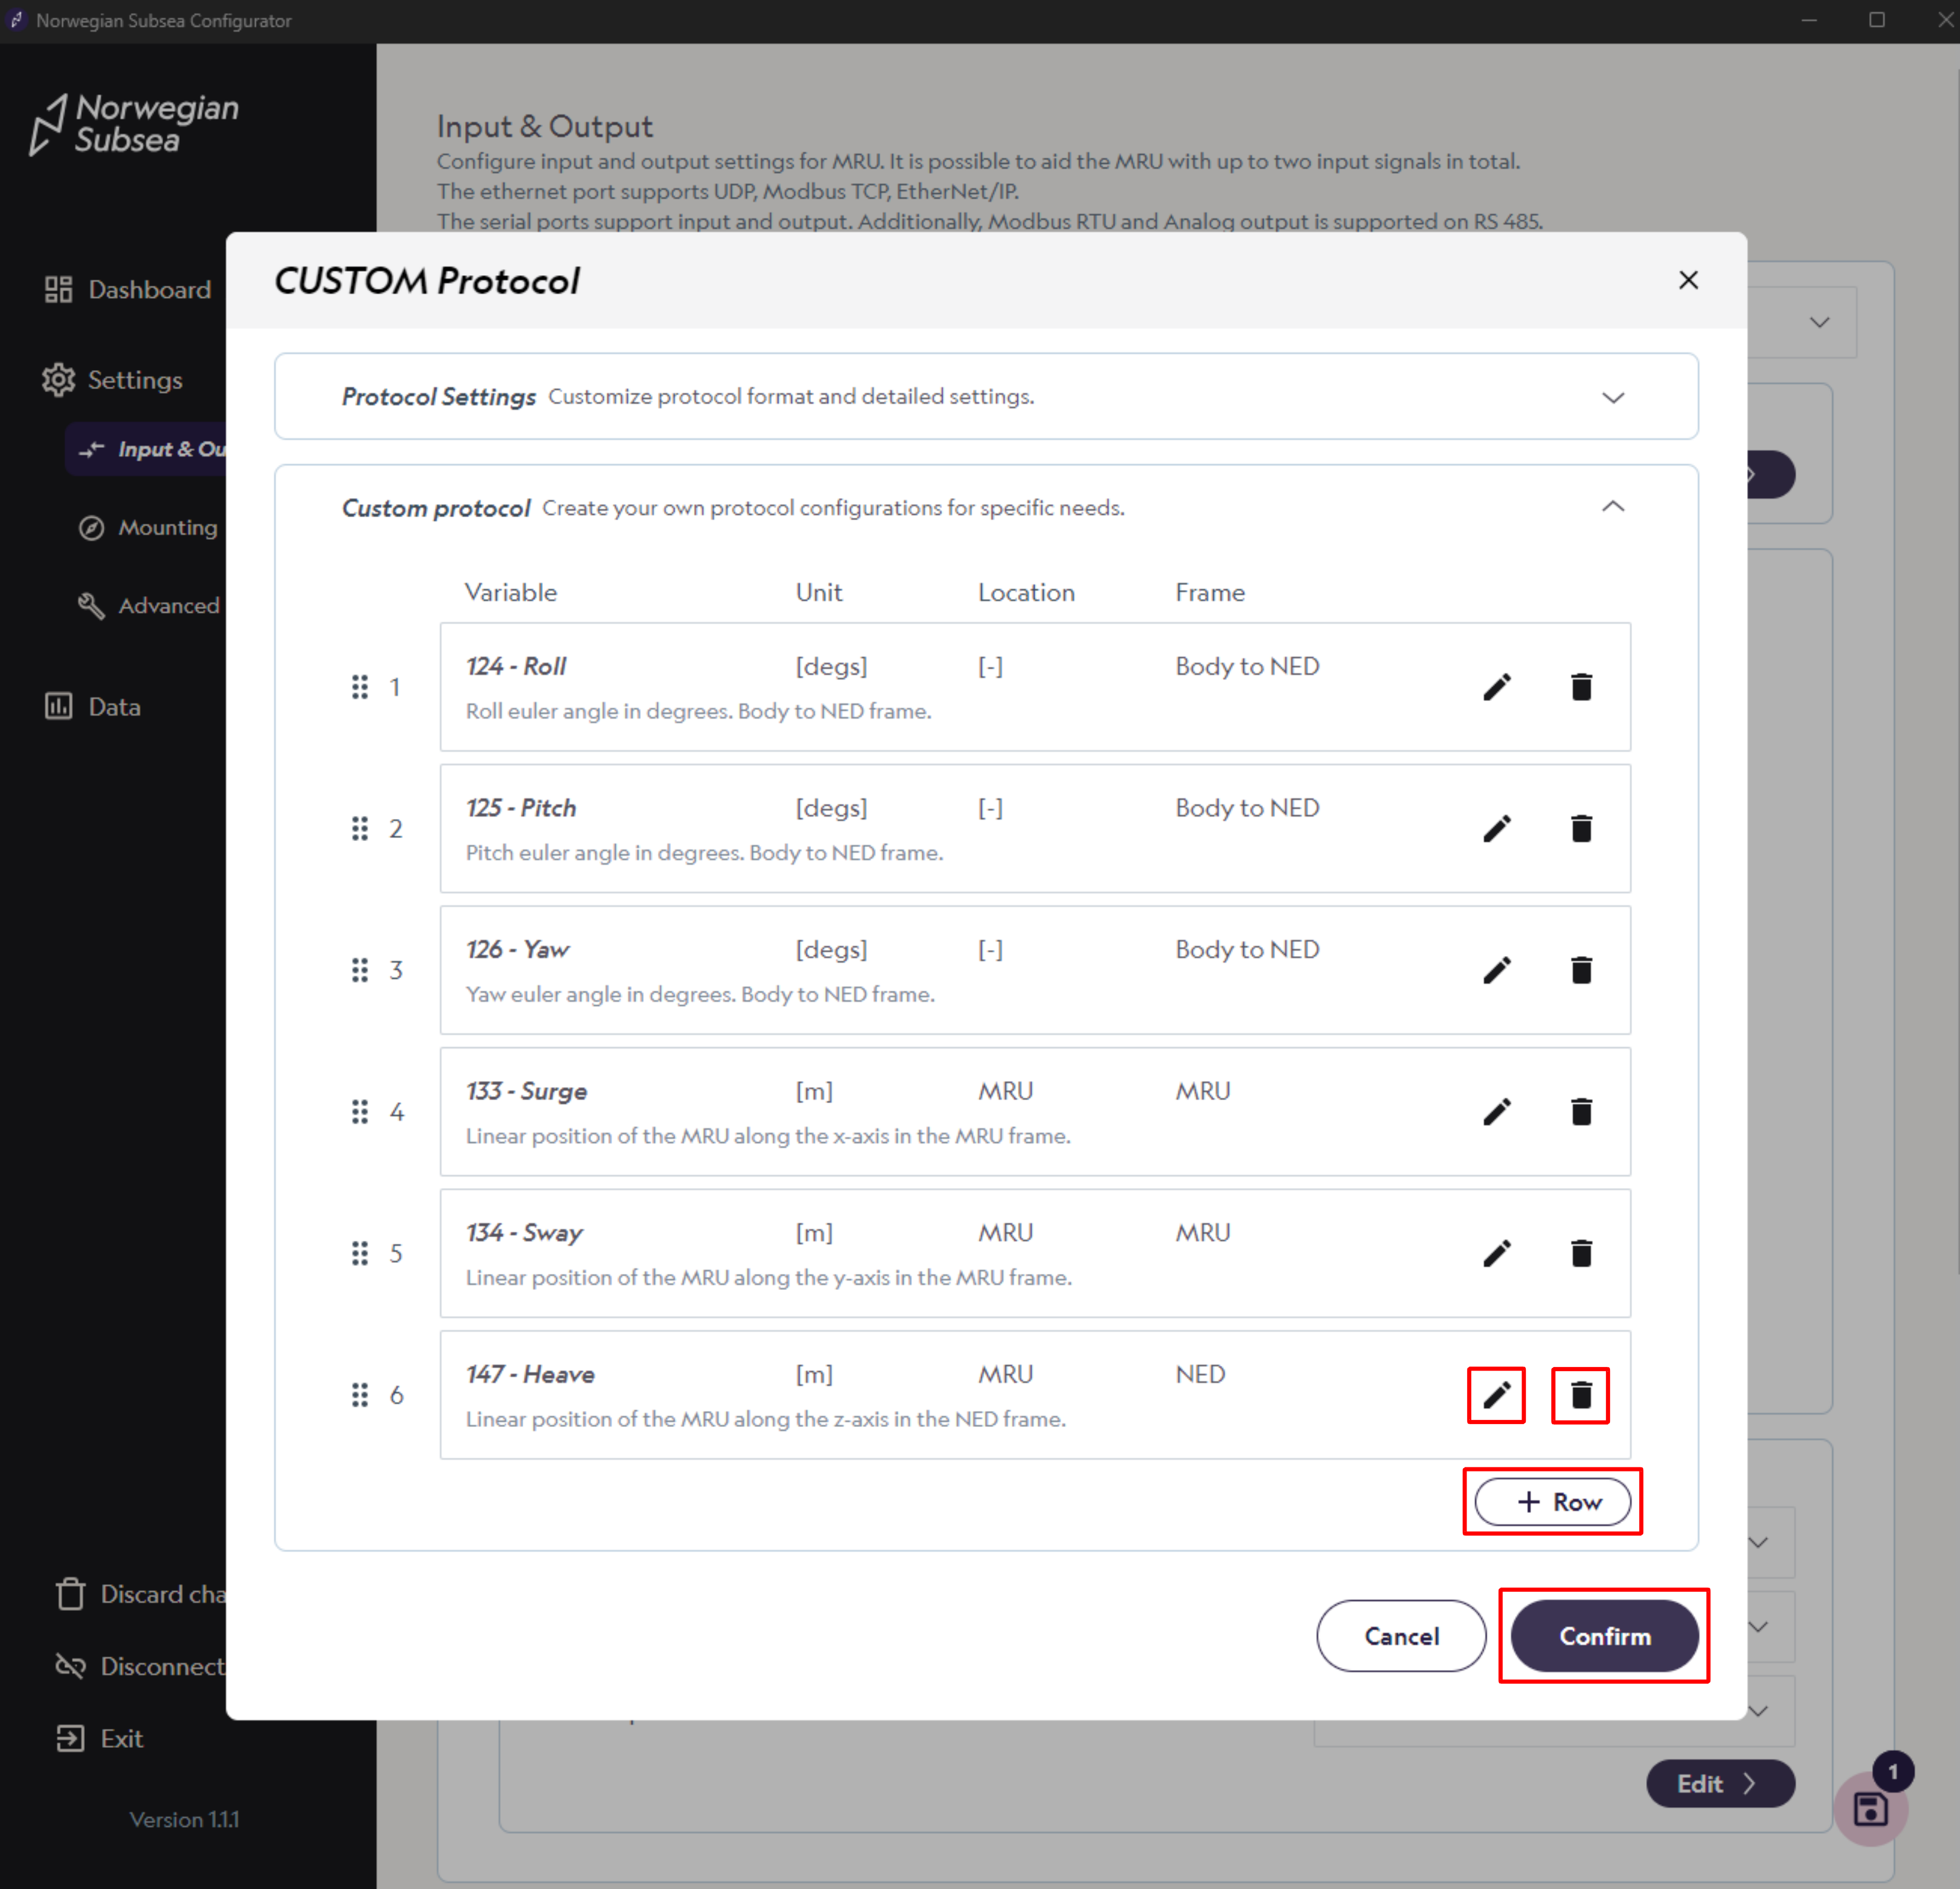
Then, customize your protocol as needed:
-
To edit existing data variable, click on the edit icon. Here you can change variable, unit, location and frame.
-
To delete existing data variables, click on the garbage icon.
-
To add a data variable, click “+ Row“. Then, select variable, unit, location and frame.
-
When modifications are done, click “Confirm“.
-
-
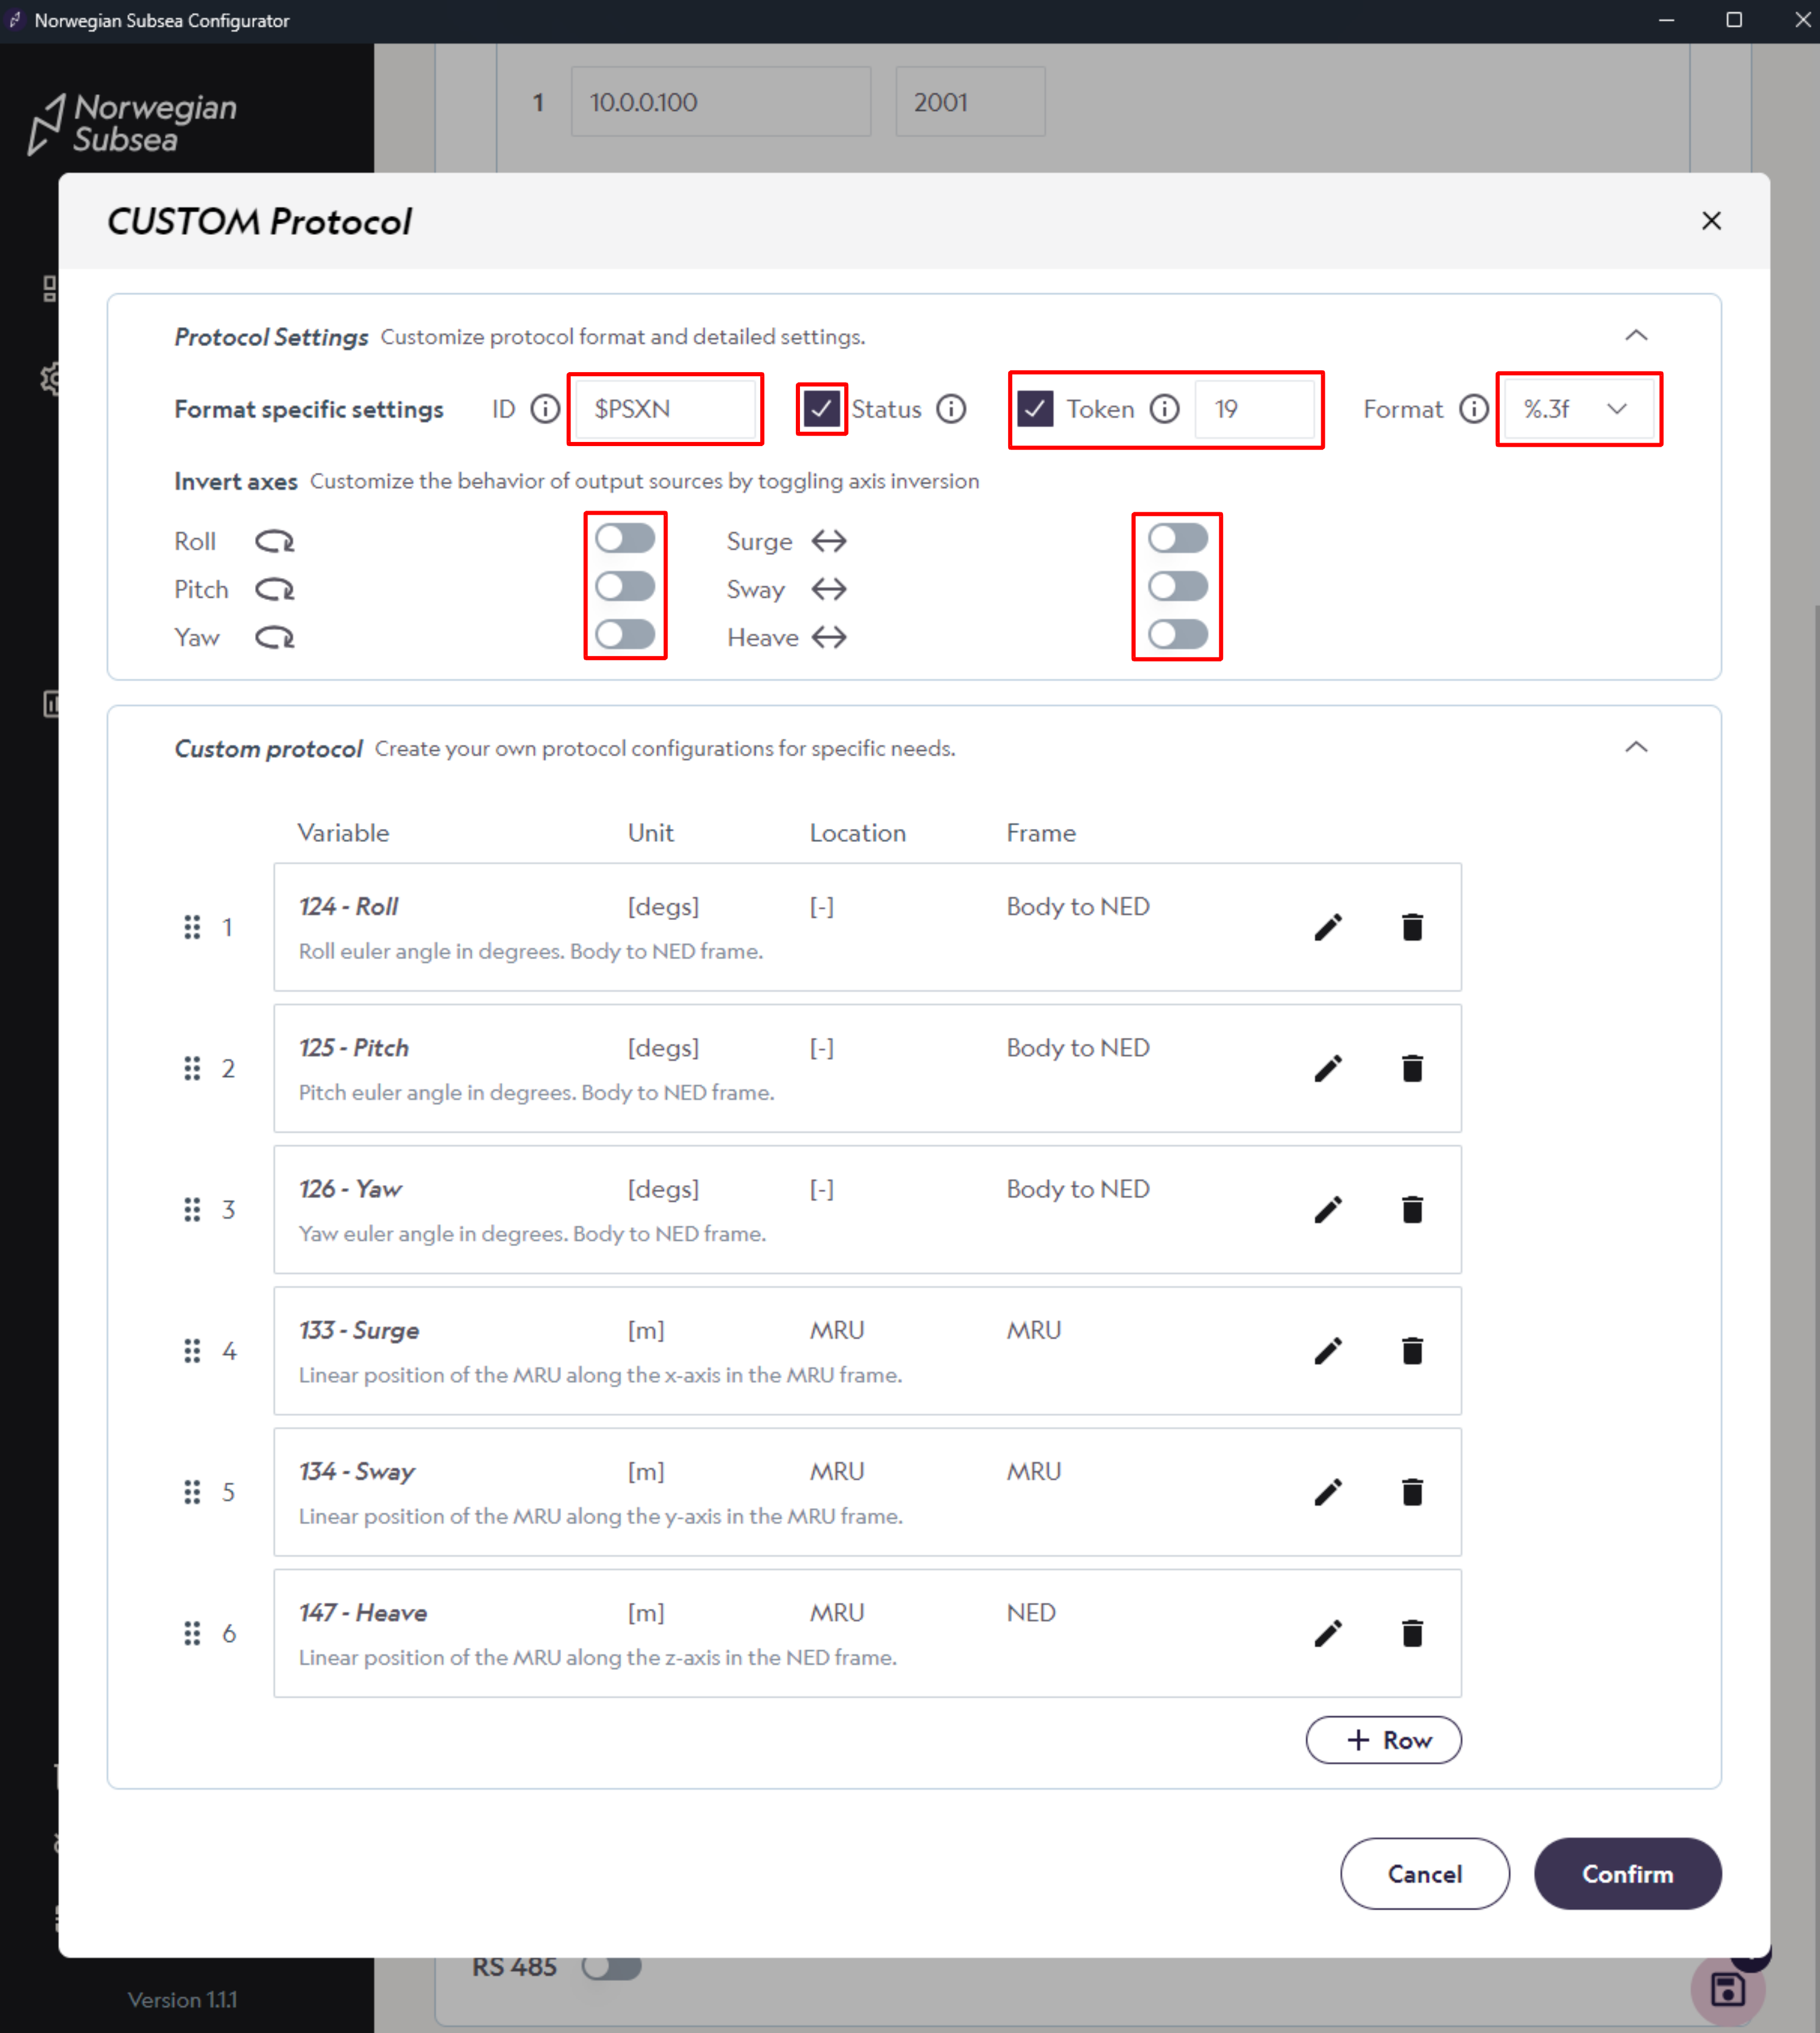
You can also customize format specific settings and invert axes if needed. For more details, see our API documentation.
Save changes
Make sure to save your changes, so they also apply after reboot.
Step 2: Stream and visualize the data
-
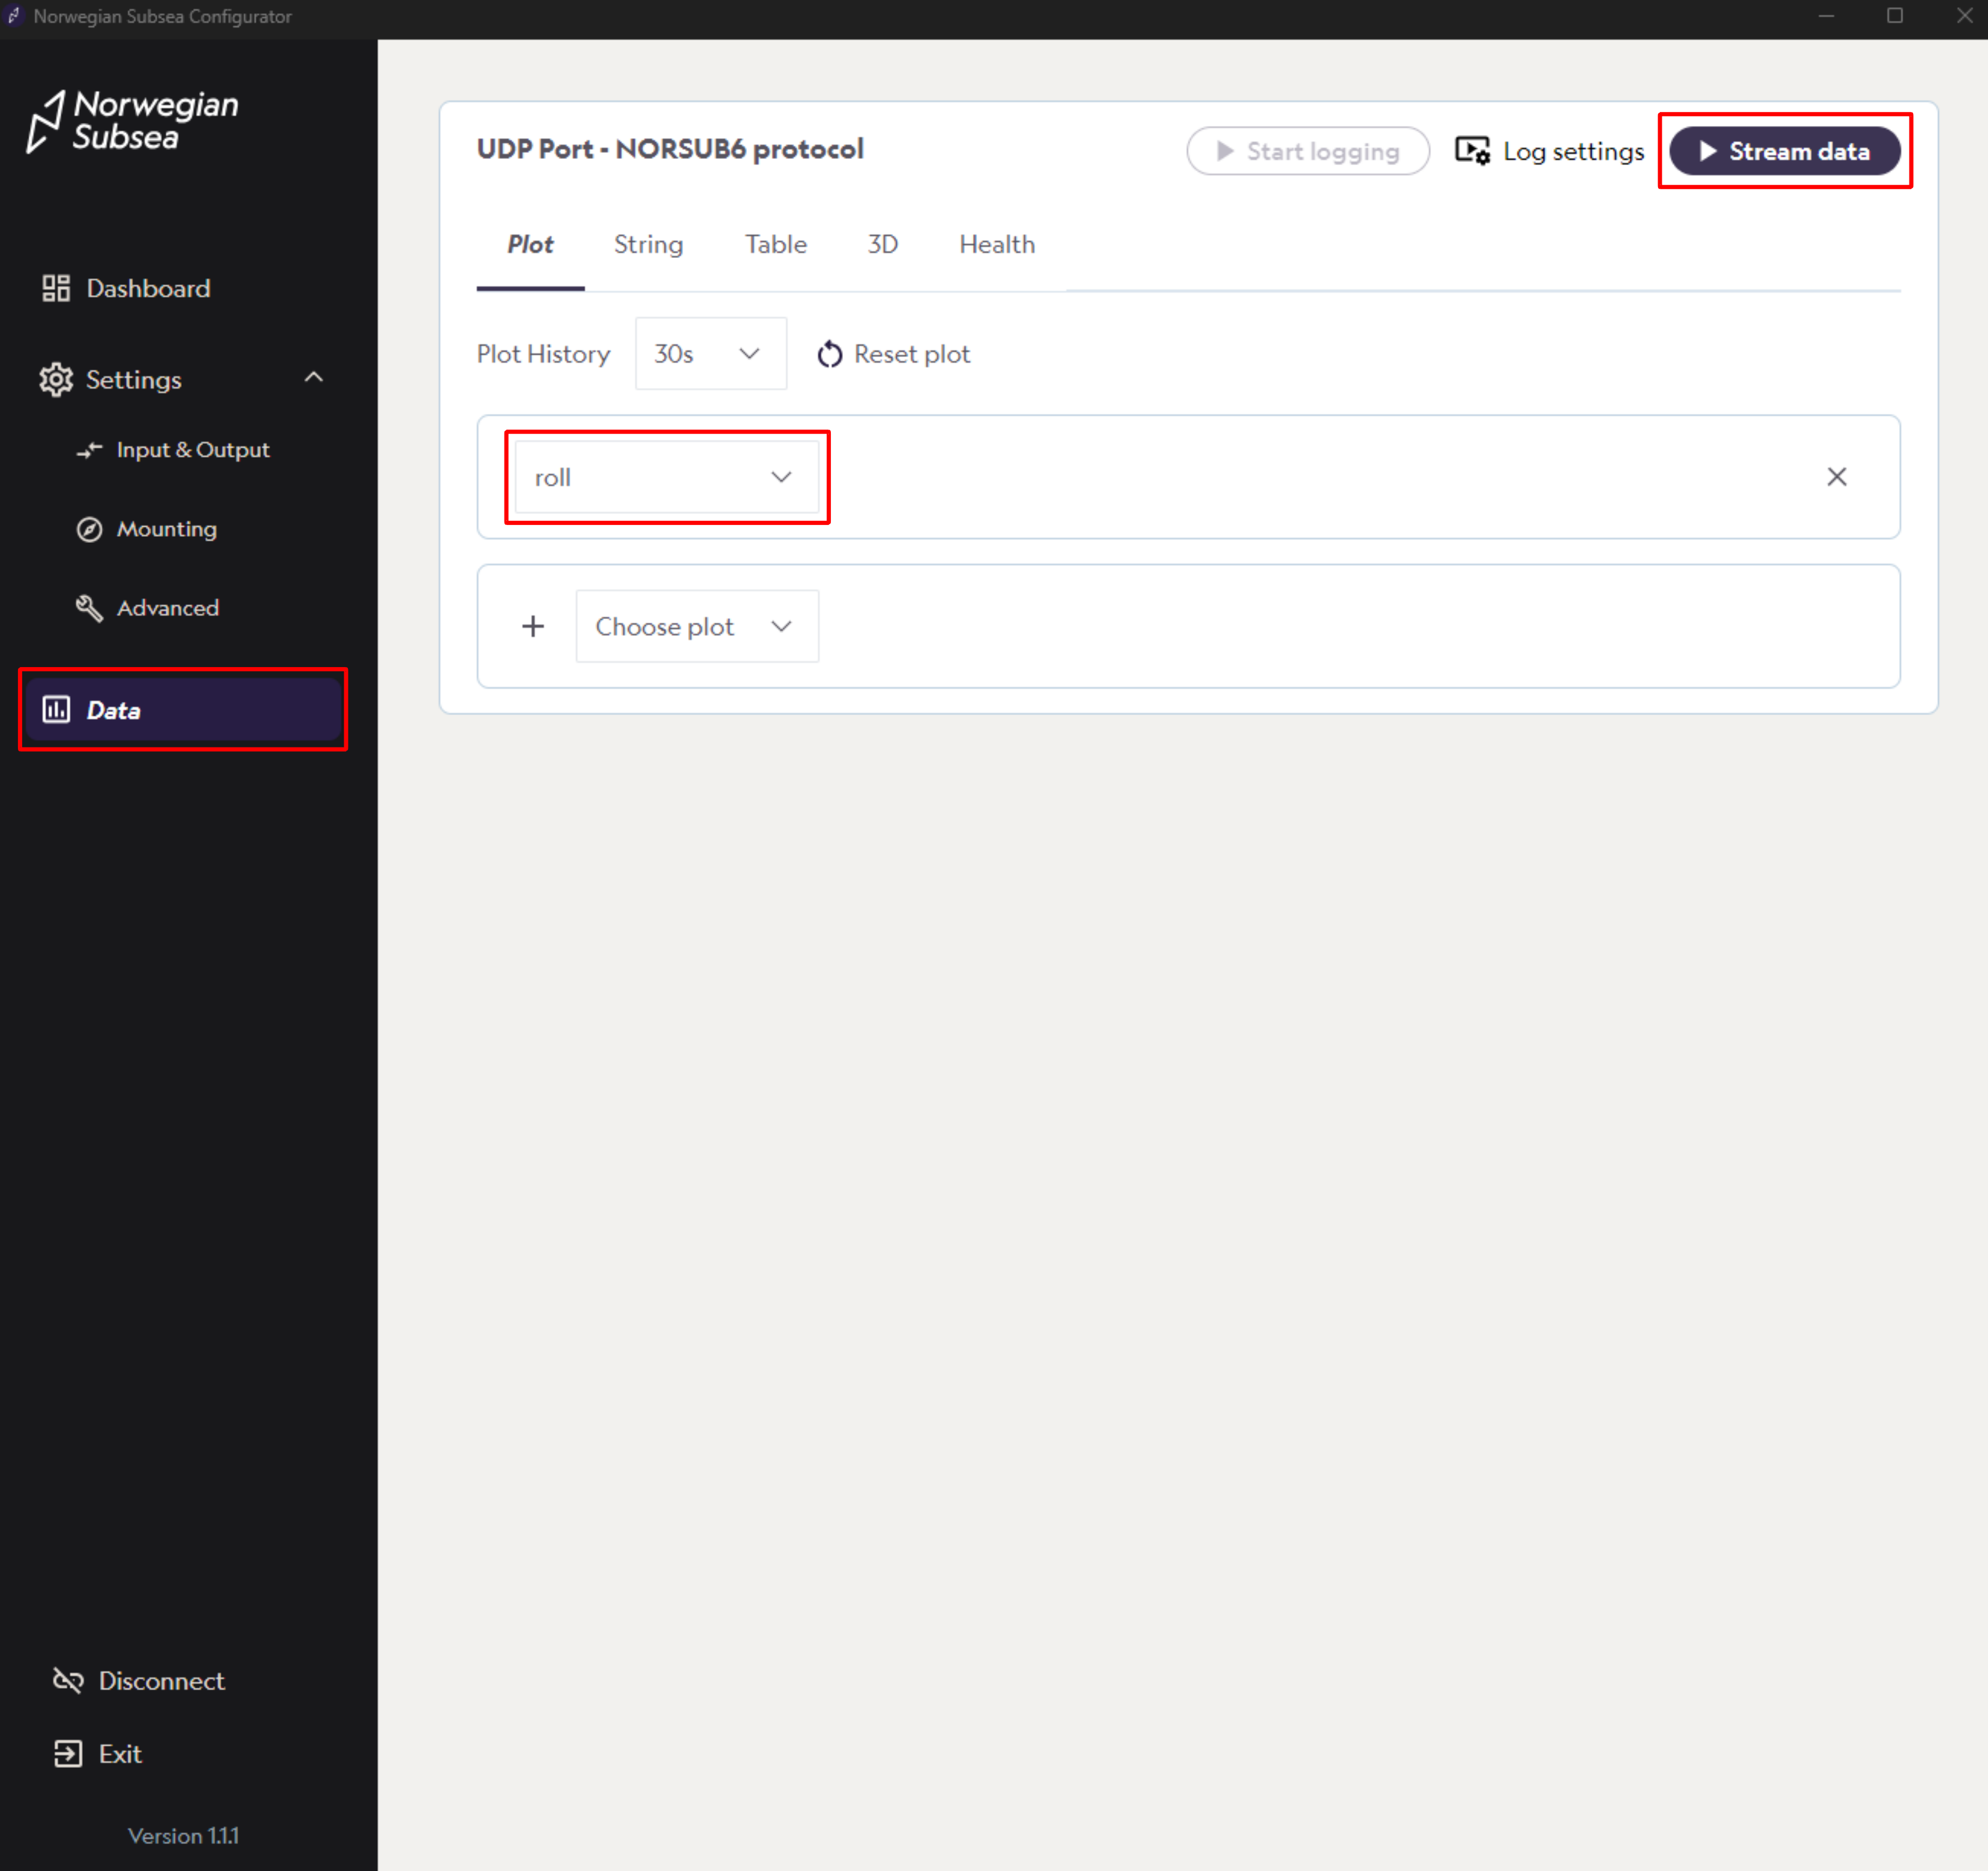
Click “Data“ in the left bar.
-
Then, click on the data variable of interest (e.g., roll) and click “Stream data“.
-
After clicking the stream buttom, you will see a real-time plot of the data variable across time.
-
Change the plot history time window after your needs
-
By clicking “Reset plot“, you can also reset the current real-time plot
-
Visualize multiple data variables by clicking “Choose plot“
-
Remove a plot by clicking “x“
-

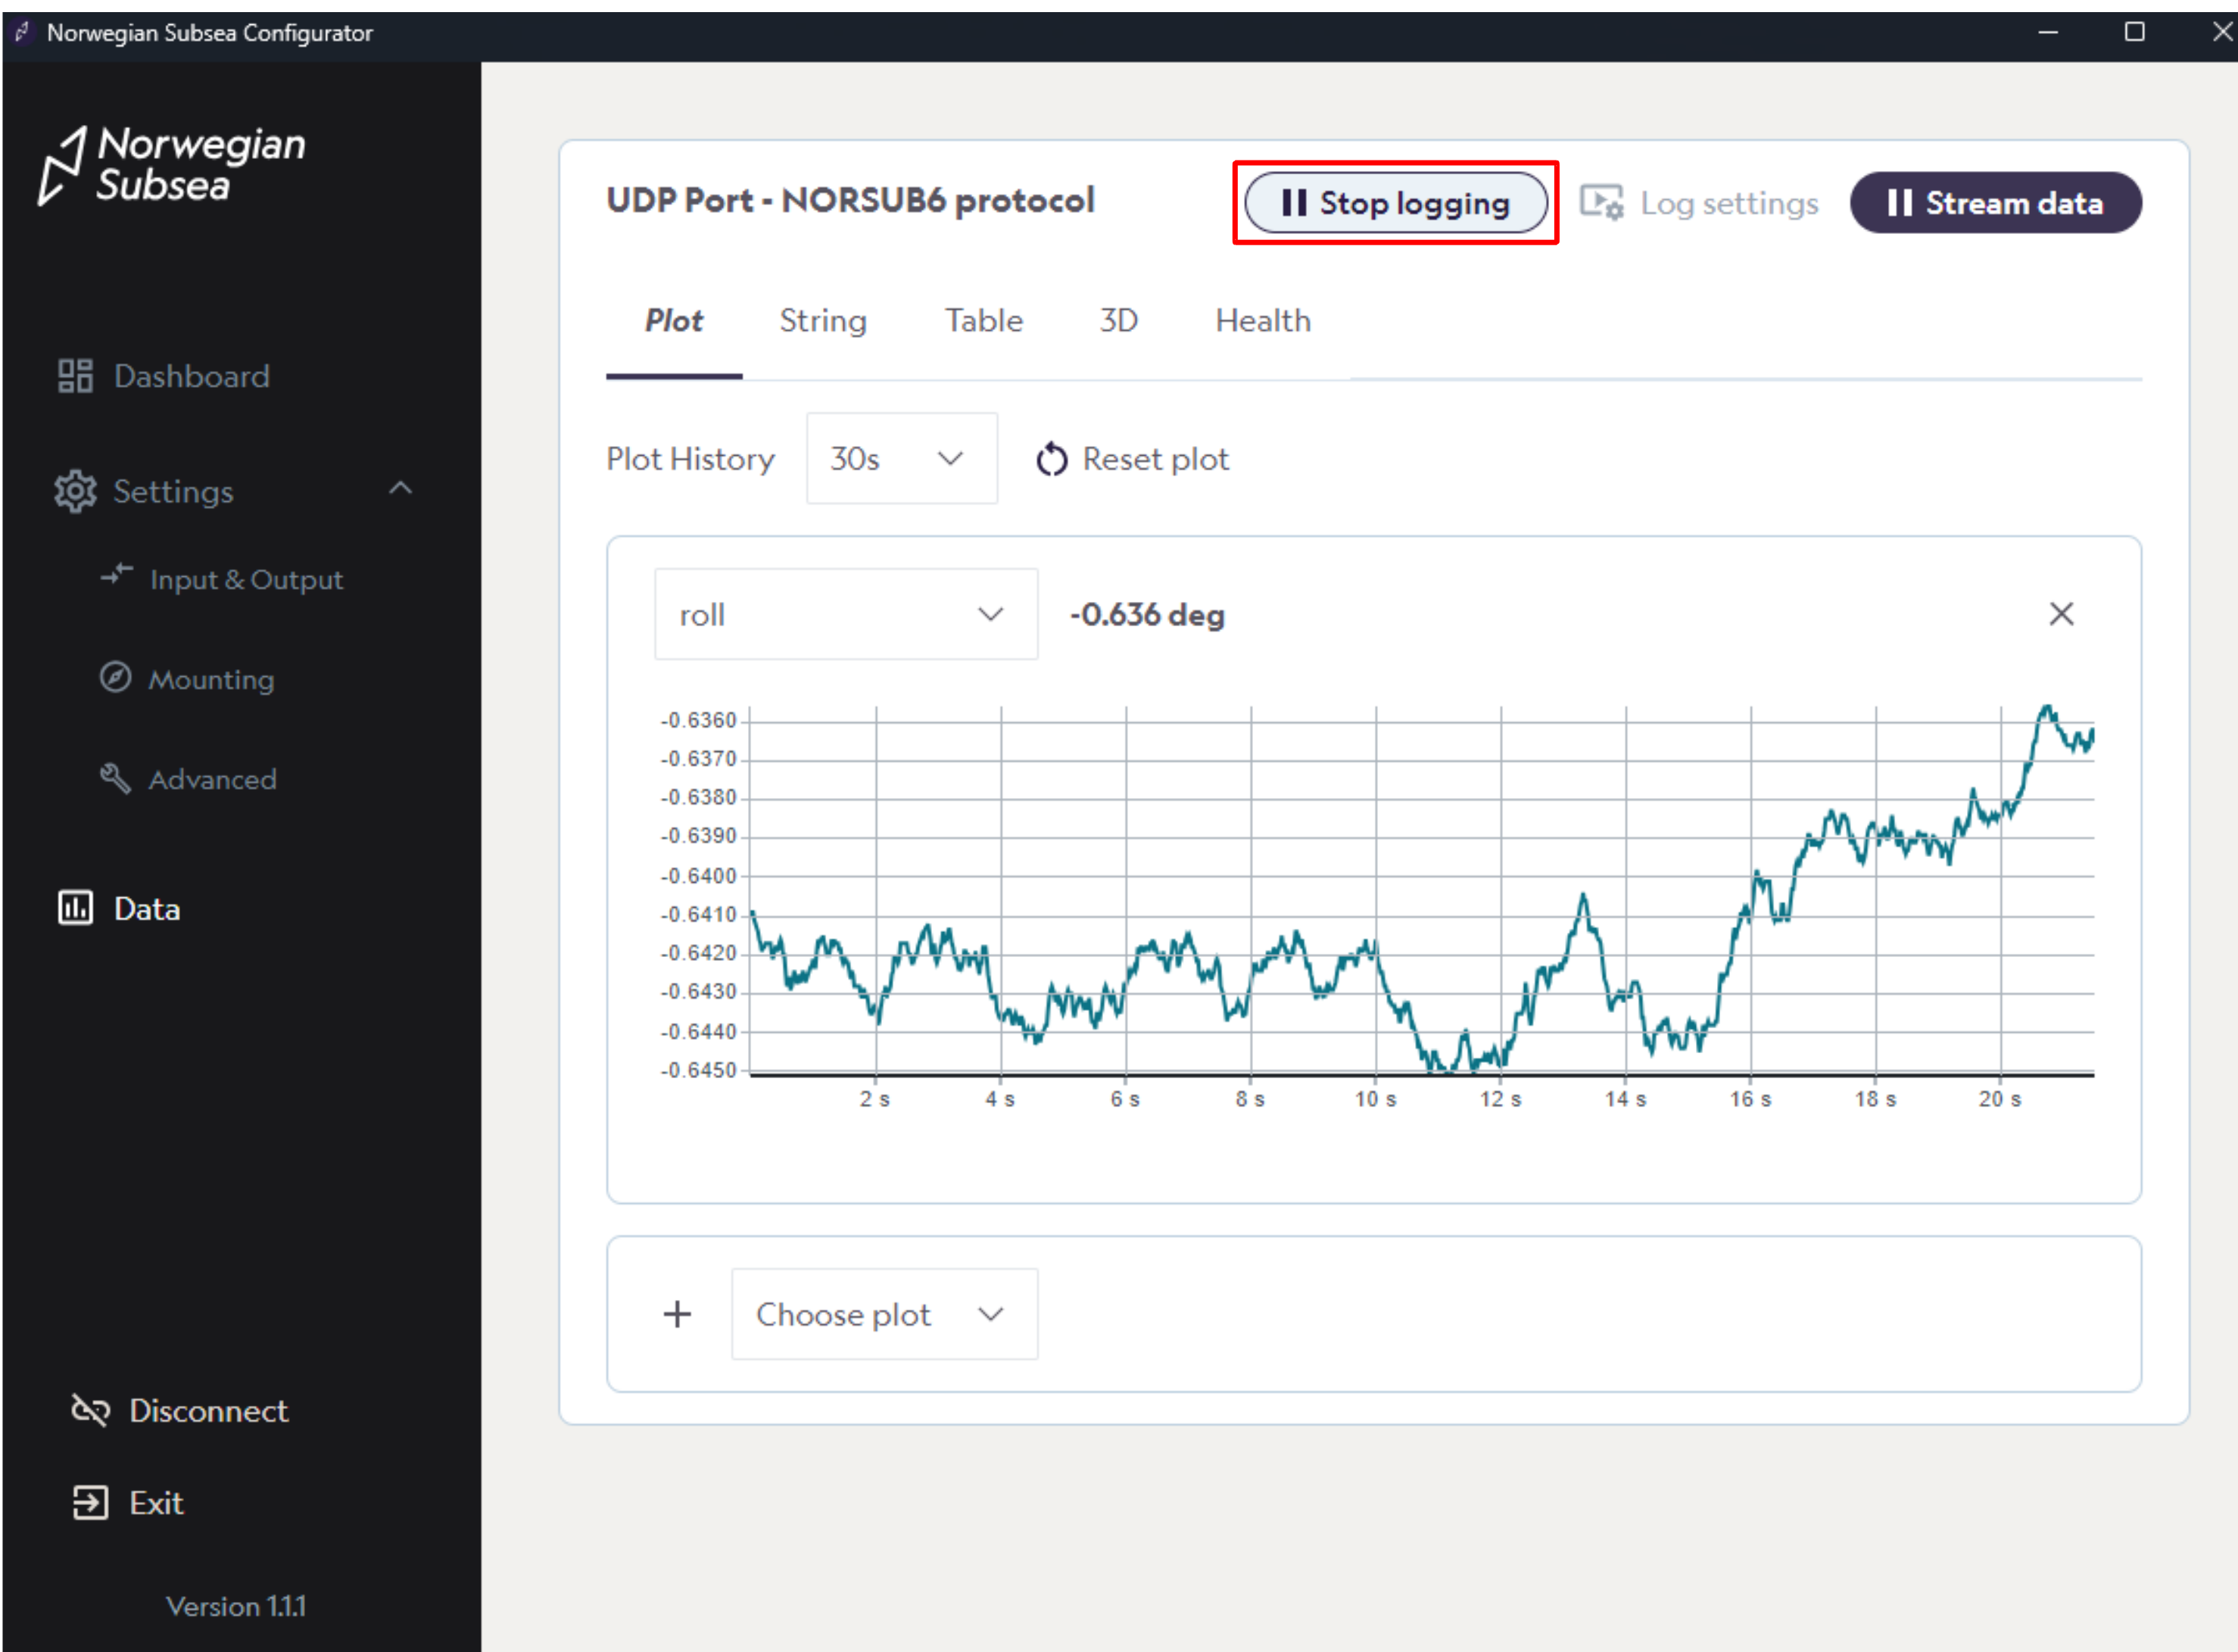
Step 3: Log data
-
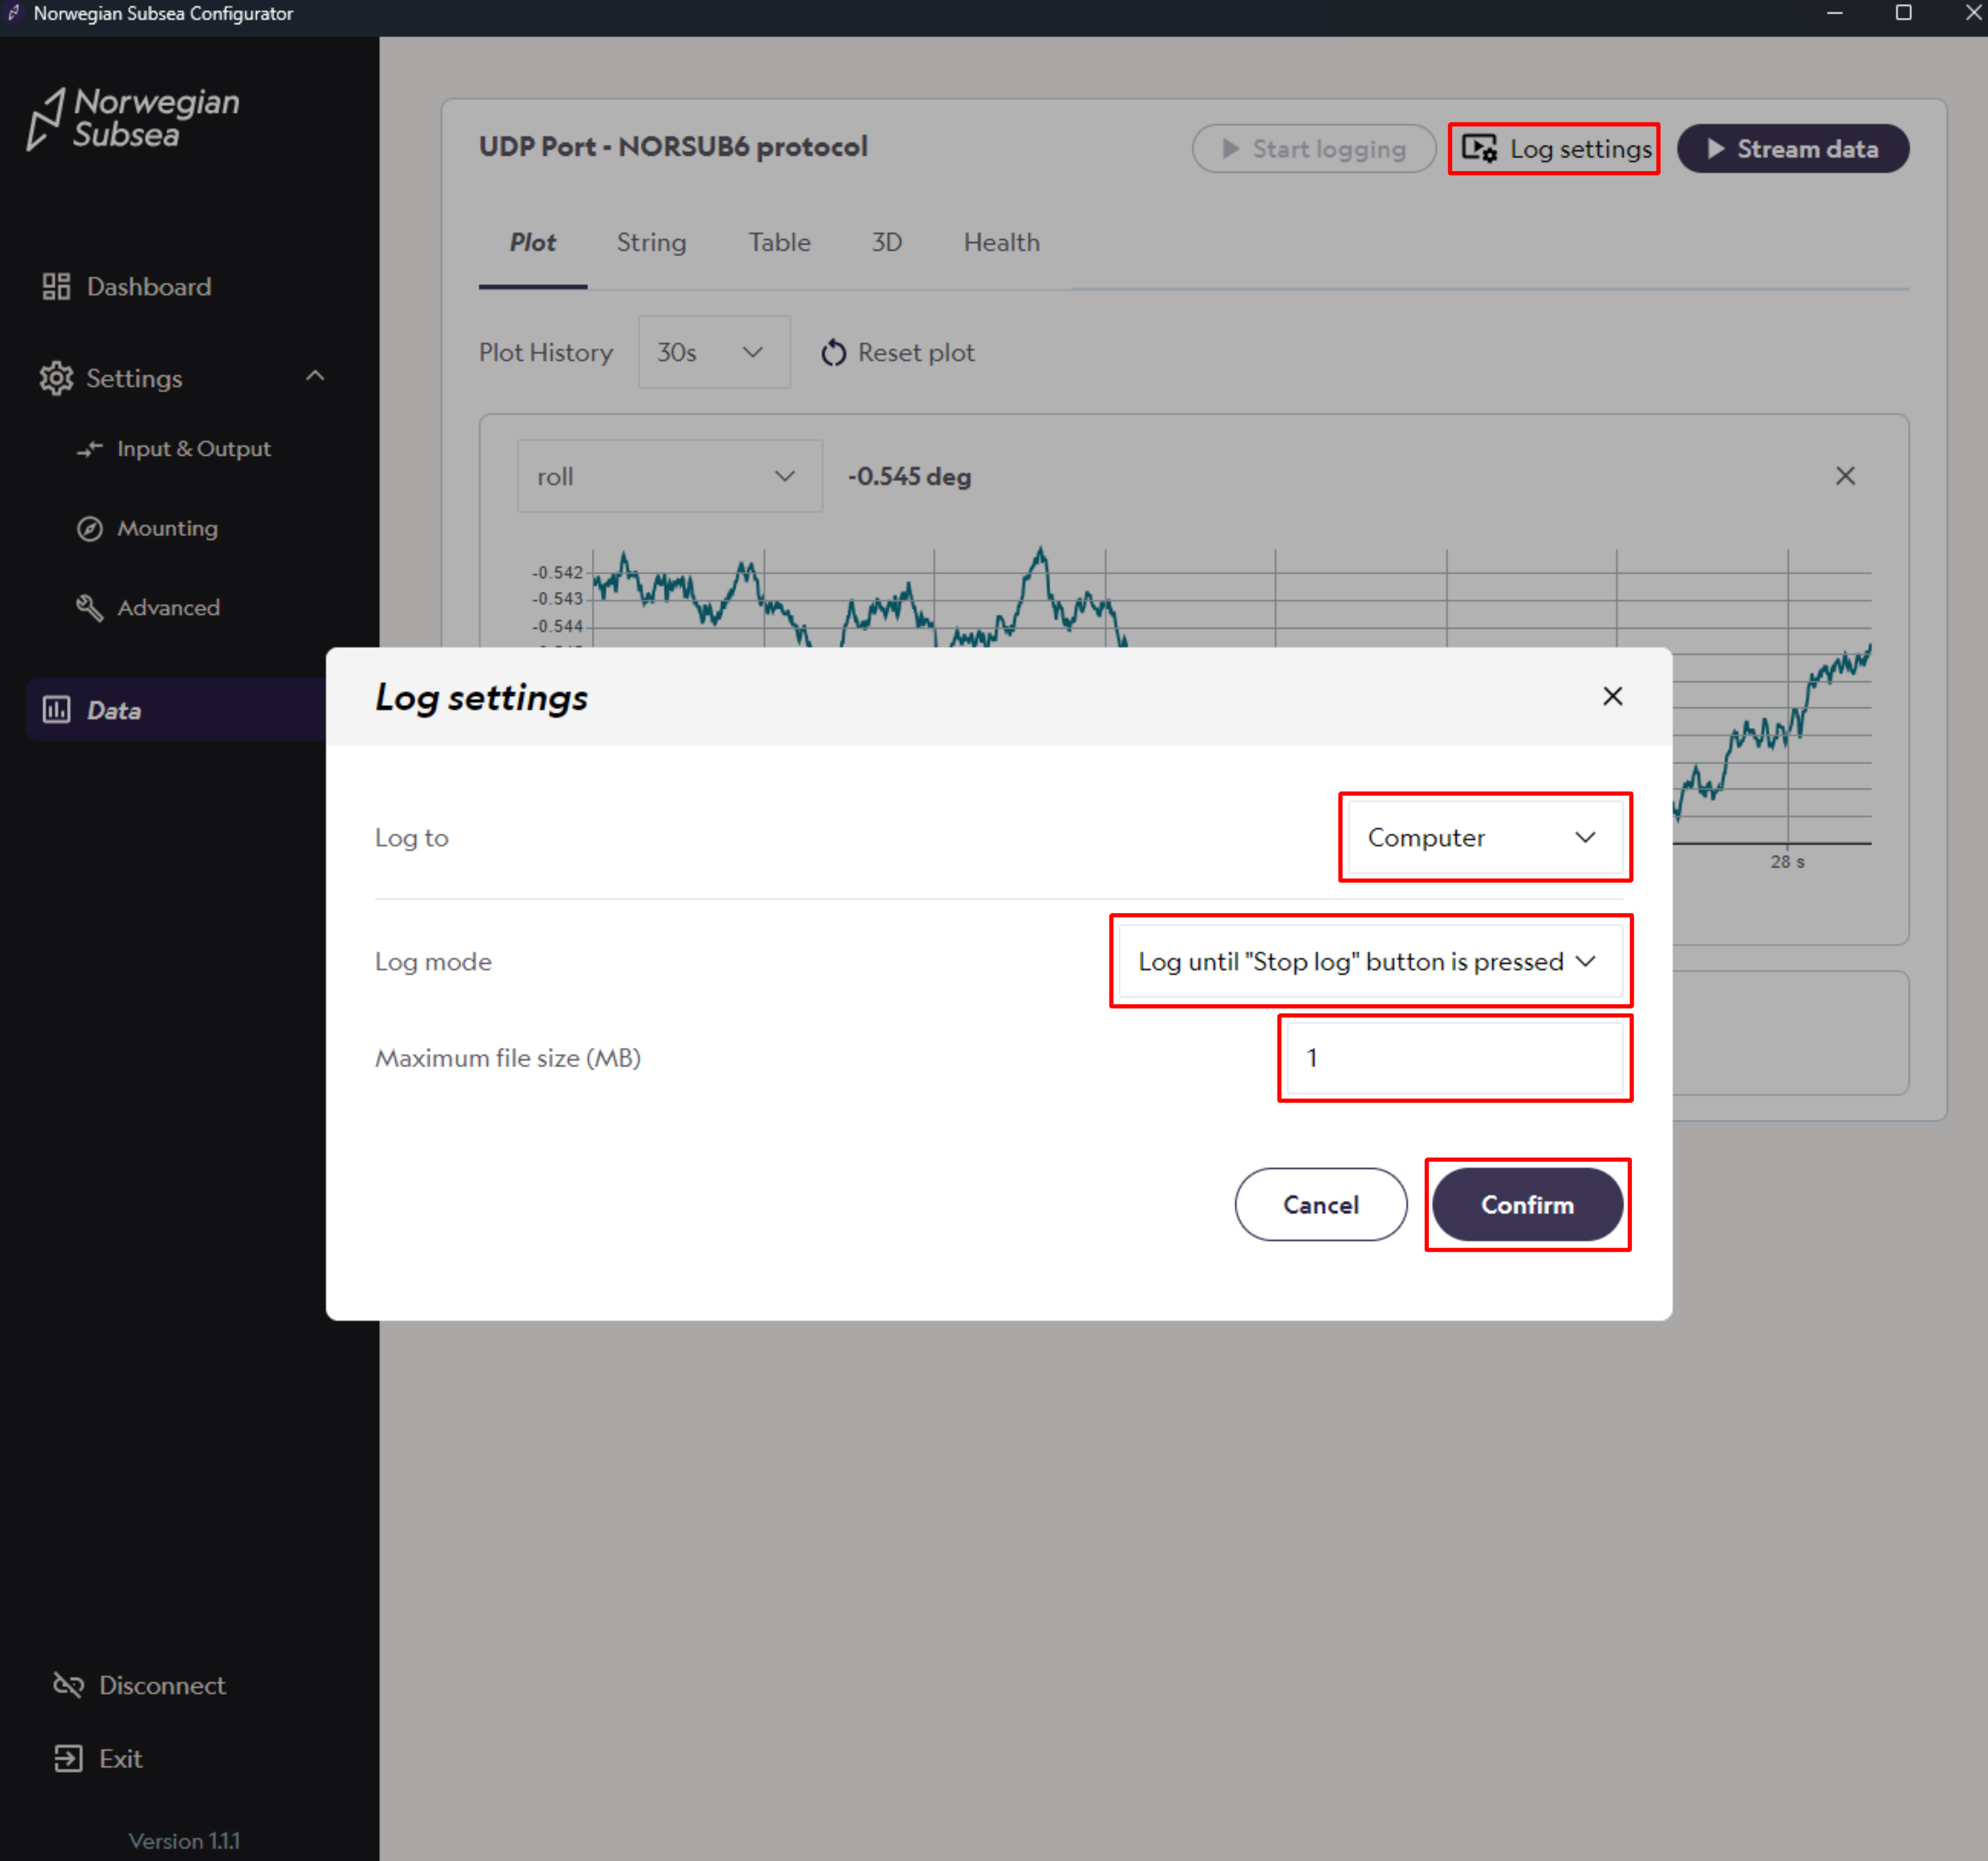
Click “Log settings“ and configure the following options:
-
Log to: Choose the storage location for the log file (local computer or internal storage).
-
Log mode: Define the condition that stops logging—either manually via the Stop Log button, after a specified number of samples, or after a set time duration.
-
Maximum file size: Set the maximum size of the log file in megabytes (MB).
-
-
Then, click “Confirm“
-
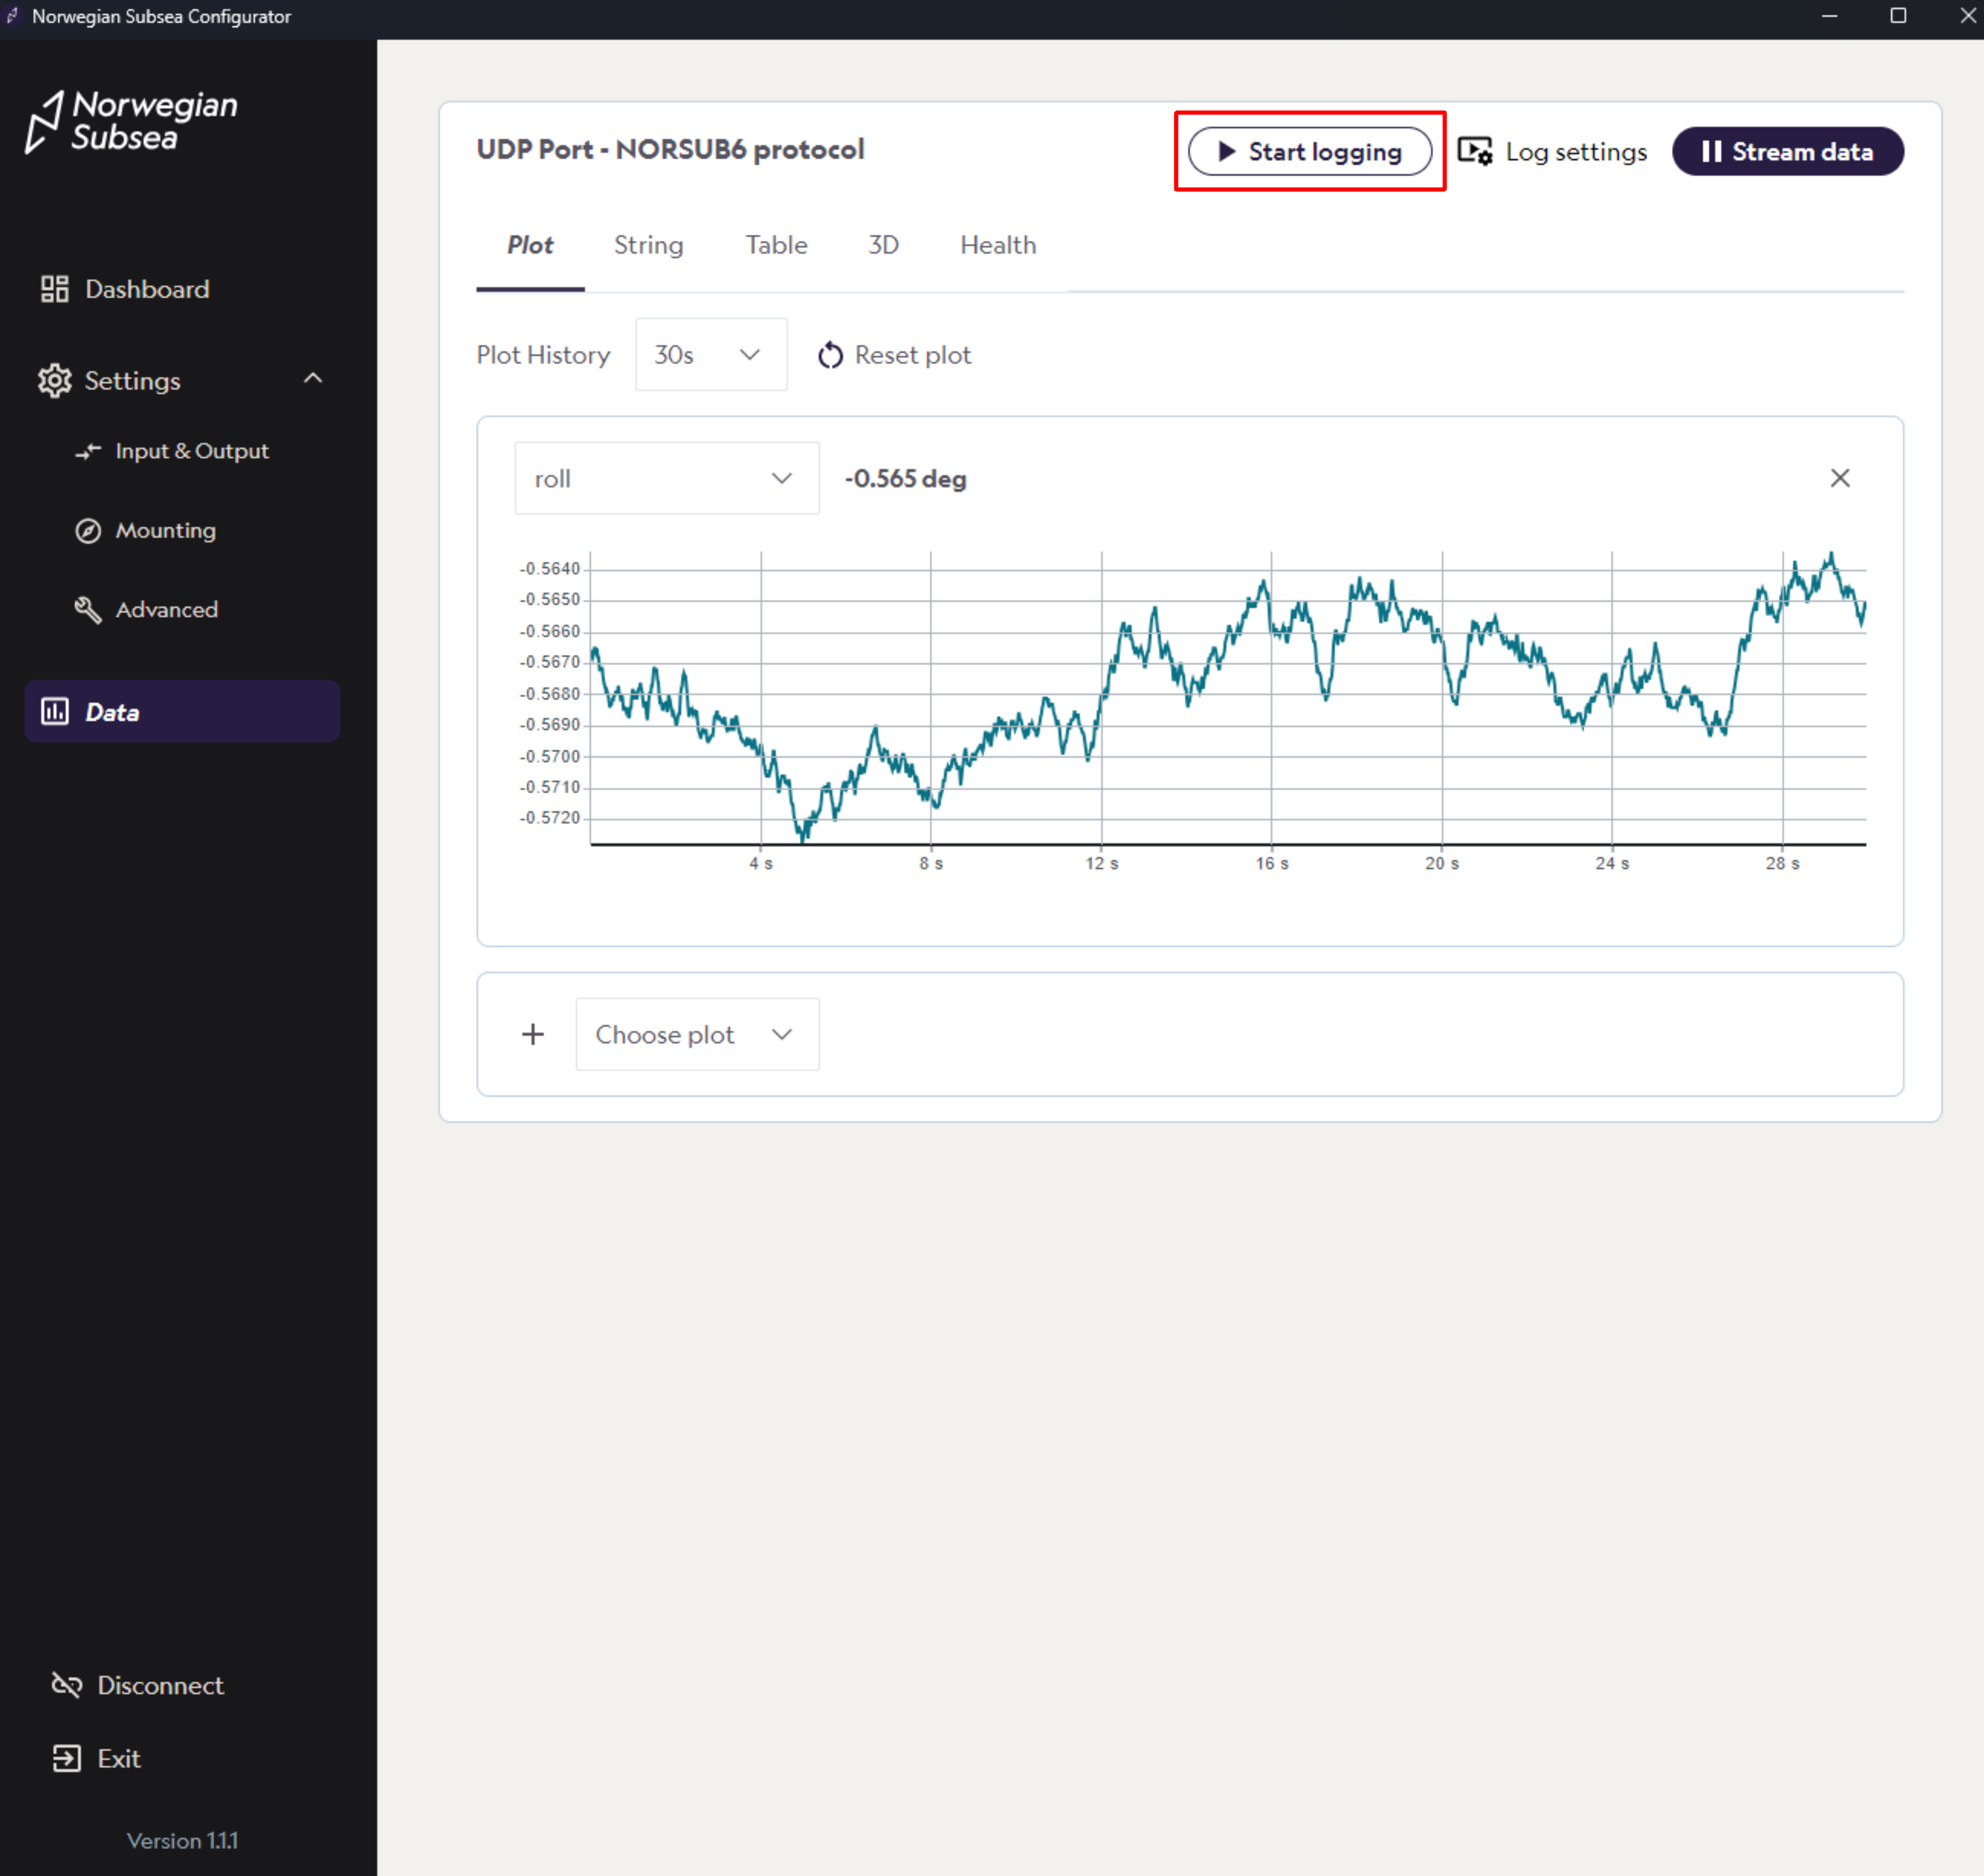
After configuration, click “Start logging“.
-
If “Log until stop button is pressed“ is chosen in log settings, click “Stop logging“ and save the file on your local computer.